What is ntopng?
ntopng (short for “Network Top”) is a high-performance, open-source network traffic monitoring tool that provides real-time visibility into network usage. It acts as a web-based interface for analyzing network flows and performance metrics, offering rich insights into bandwidth consumption, active hosts, protocols, ports, top talkers, and more.
ntopng runs on various platforms including Debian 12, and is widely used in both enterprise and SMB environments for network monitoring, diagnostics, and security visibility.
Key Features of ntopng
Web-Based Network Dashboard
- Real-time web interface to monitor network activity.
- Drill-down views into IP addresses, subnets, and protocols.
Traffic Analysis
- Monitors Layer 2–7 traffic including TCP, UDP, ICMP, and application-level protocols.
- Displays top talkers, top ports, top applications, and network flows.
- Categorizes traffic by country, AS (Autonomous Systems), and endpoints.
Security Visibility
- Identifies network anomalies, suspicious flows, and potential threats.
- Integrates with nDPI (ntop’s deep packet inspection library) for protocol detection.
- Tracks intrusion attempts, DNS tunneling, and DDoS activity.
Data Sources and Integration
- Works with:
- Network interfaces (live packet capture)
- NetFlow/sFlow/IPFIX exporters (routers, switches)
- ZMQ (ZeroMQ) for scalable deployments
- Integrates with ntopng Enterprise, nProbe, Elastic Stack, and Grafana.
Reporting and Alerts
- Automatically generates traffic reports and visual graphs.
- Supports custom alerting rules for anomalies or thresholds.
- Stores historical traffic data for long-term trend analysis.
Host and Device Tracking
- Maps internal IPs to MAC addresses, usernames (via DHCP, Active Directory, RADIUS).
- Detects device types and operating systems using passive fingerprinting.
ntopng Editions
| Edition | Description |
|---|---|
| Community (Free) | Open-source version with essential monitoring features. |
| Professional | Adds historical data retention, protocol details, and thresholds. |
| Enterprise M/L/XL | Designed for ISPs, data centers, and enterprise networks. Offers multi-interface support, advanced filtering, and export capabilities. |
ntopng vs Other Network Monitoring Tools
| Feature | ntopng | Wireshark | Zabbix | Nagios | Netdata |
|---|---|---|---|---|---|
| Real-Time Traffic Monitoring | ✅ Yes | ⚠️ Yes (packet-level) | ❌ No (uses SNMP/agent data) | ❌ No | ✅ Yes |
| Web Interface | ✅ Yes | ❌ No | ✅ Yes | ✅ Yes | ✅ Yes |
| Deep Packet Inspection | ✅ Yes (via nDPI) | ✅ Yes | ❌ No | ❌ No | ❌ No |
| NetFlow/sFlow Support | ✅ Yes | ❌ No | ✅ Yes (via plugins) | ✅ Yes (via plugins) | ❌ No |
| Security Features | ✅ Threat detection | ⚠️ Manual | ⚠️ Limited | ⚠️ Limited | ❌ No |
| Alerting | ✅ Yes | ❌ No | ✅ Yes | ✅ Yes | ✅ Yes |
| Ease of Use | ✅ Easy | ⚠️ Steep learning curve | ⚠️ Moderate | ⚠️ Moderate | ✅ Very easy |
| Installation on Debian | ✅ Simple | ✅ Simple | ✅ Simple | ✅ Simple | ✅ Simple |
Why Use ntopng on Debian 12?
- Debian 12’s stability makes it a perfect host OS for ntopng in production.
- ntopng supports modern kernel interfaces and optimized packet capture, especially with
PF_RING. - Can be deployed on bare metal or virtualized environments with minimal resource usage.
- Great choice for network administrators, IT security teams, and sysadmins looking for a real-time network visibility tool.
Typical Use Cases
✅ LAN/WAN Monitoring – Visualize traffic within internal networks.
✅ ISP or Data Center – Analyze client usage, top users, and protocols.
✅ Network Security Monitoring – Detect unusual behaviors or threats.
✅ Traffic Accounting – Generate bandwidth usage reports per host or protocol.
✅ Integration with SIEM – Export alerts to third-party tools for unified incident management.
Limitations (Free Version)
- No historical data retention or long-term storage.
- Limited customization of reports and alerts.
- No remote interface monitoring (multiple interfaces limited to paid editions).
ntopng on Debian 12 is a robust, real-time network monitoring solution for both technical users and IT professionals. Whether you’re monitoring a small LAN, an enterprise WAN, or a service provider backbone, ntopng delivers clear, actionable insights into network performance, traffic patterns, and security events. Its lightweight footprint, advanced analytics, and ease of use make it a go-to tool for network visibility in Linux environments.
Step 1: Create a Debian 12 Instance
Before beginning the installation, you need a server running Debian 12. Follow these steps to create one on Shape.Host:
Log in to your Shape.Host account.
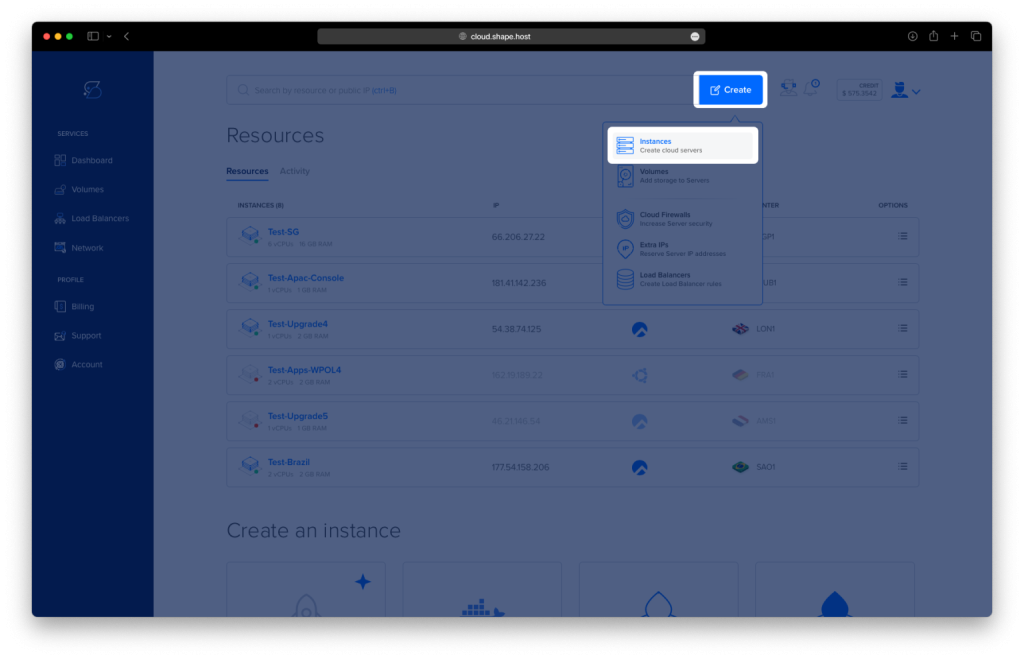
In the dashboard, click on “Create” in the top menu.
Choose “Instances” to start setting up a new VPS.
Select a location close to your users for low latency.
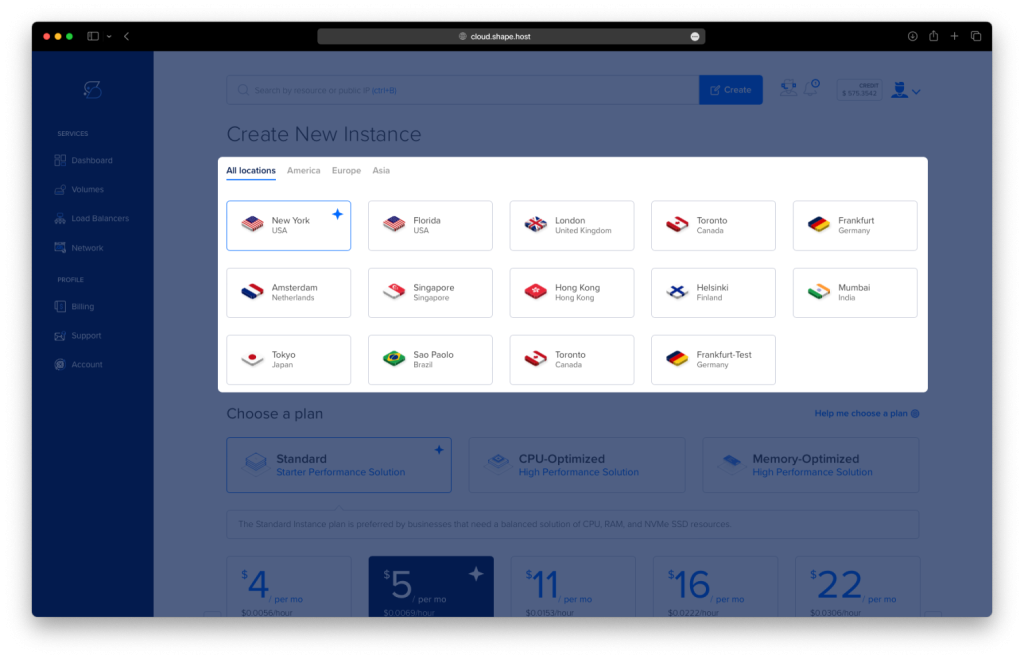
Pick a plan based on your bandwidth and performance needs.
For the OS, choose Debian 12.
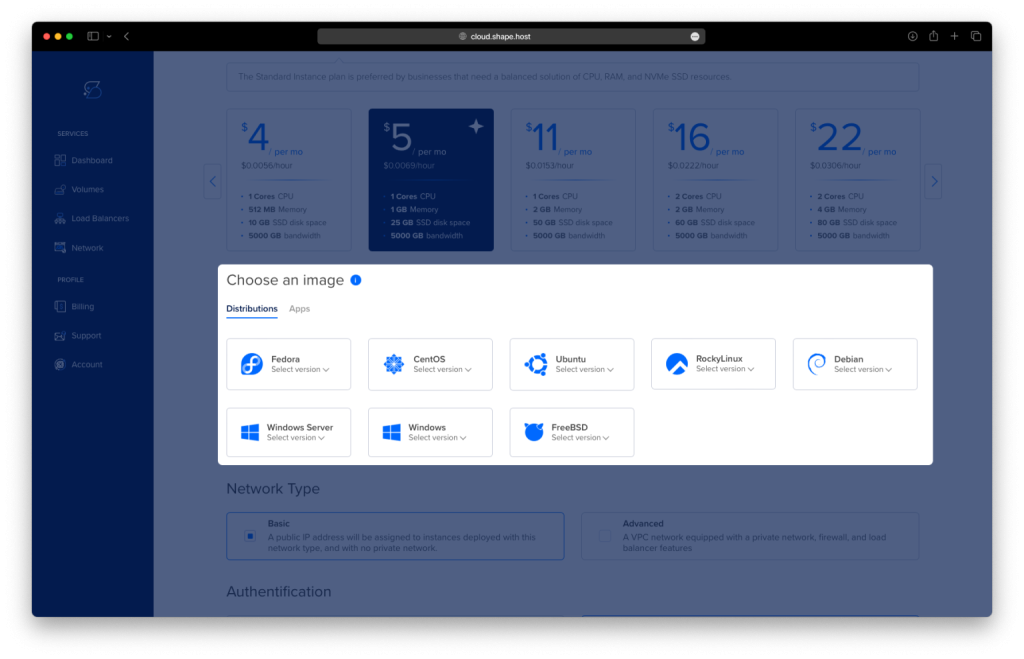
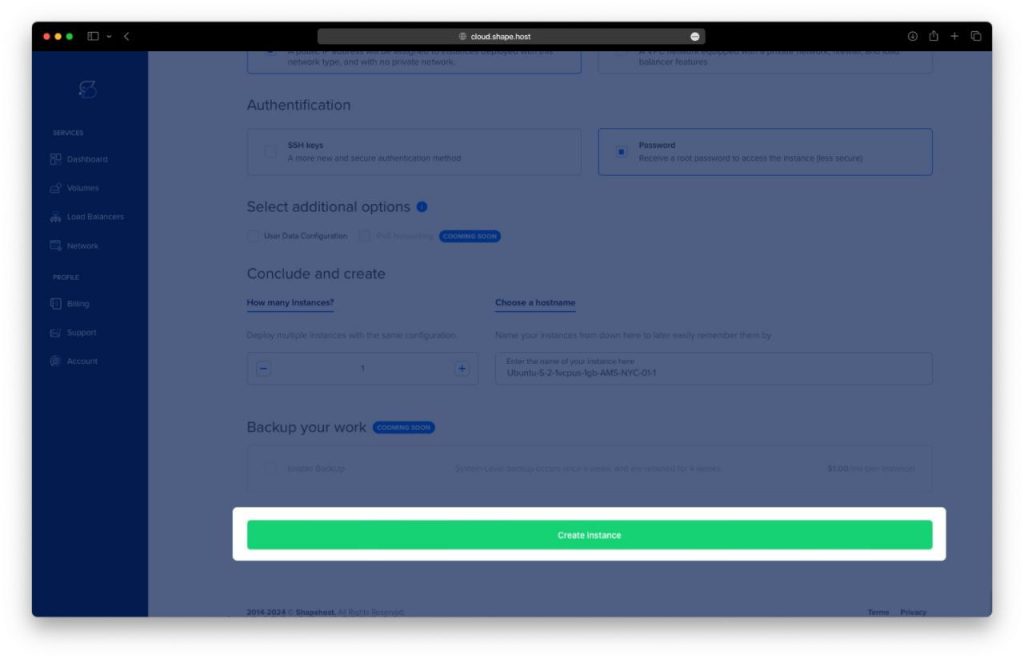
Set your authentication method (password or SSH key).
Click “Create Instance” to launch your VPS.
Once the instance is created, go to the Resources section to find the public IP address of your instance. You will use this to connect to the instance remotely.
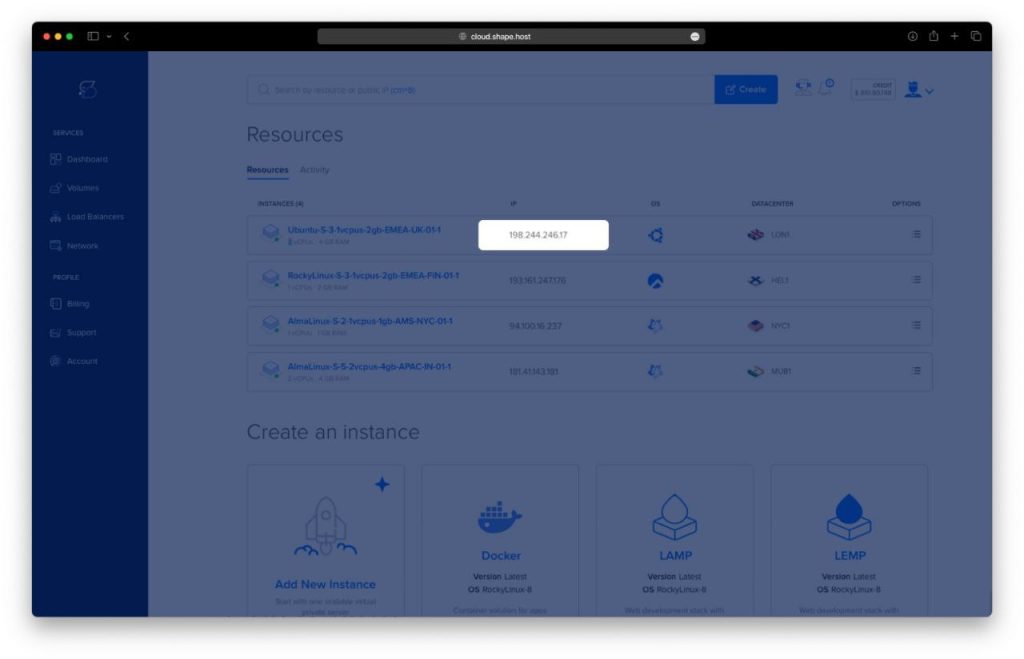
Once the server is active, connect via SSH:
ssh root@your-server-ip
Step 2: Update the System
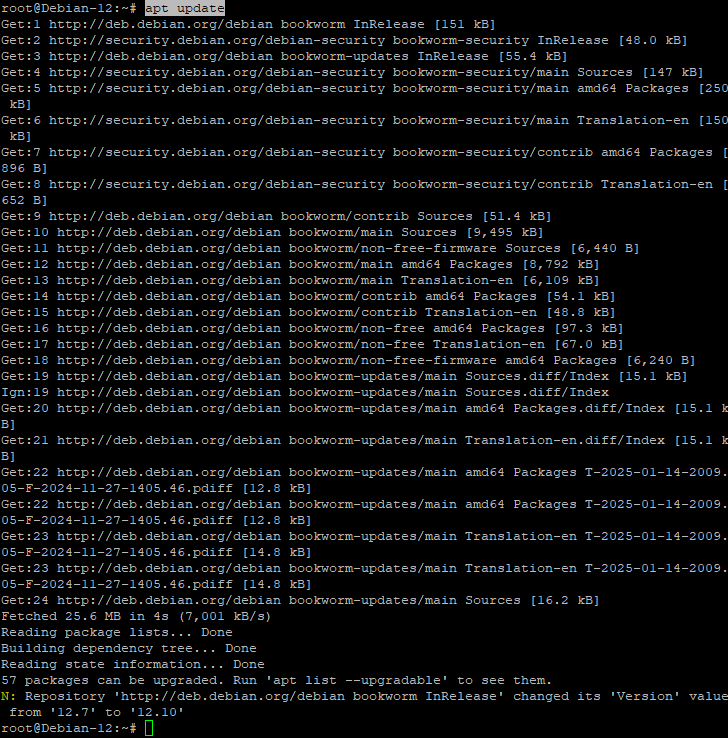
Update your system’s package list to ensure everything is current:
apt update
Step 3: Install Required Tools
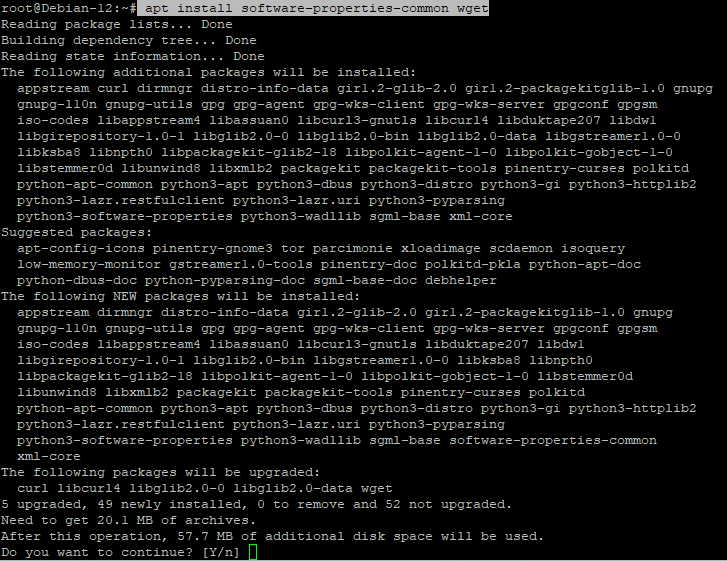
Install essential packages needed to manage external repositories:
apt install software-properties-common wget -y
Step 4: Add the ntop Repository
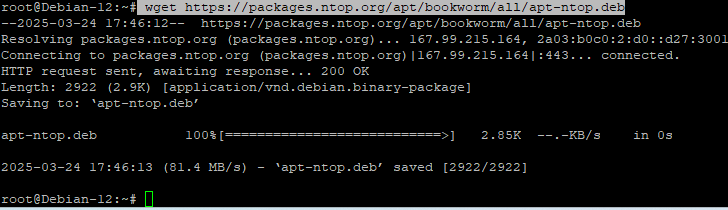
Download the ntopng repository configuration for Debian 12 (Bookworm):
wget https://packages.ntop.org/apt/bookworm/all/apt-ntop.deb
Then install it:
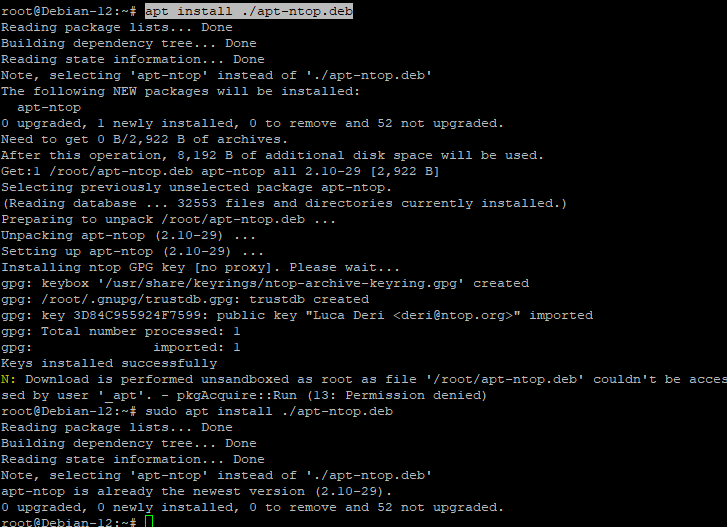
apt install ./apt-ntop.deb
If needed, confirm installation with:
sudo apt install ./apt-ntop.deb
Step 5: Install ntopng
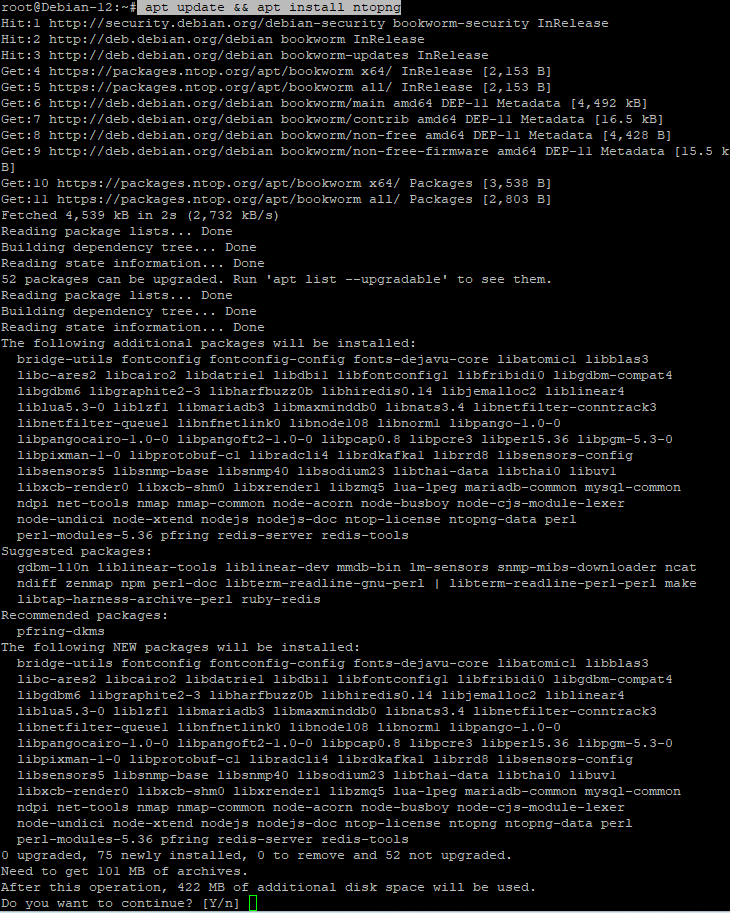
Now update your package list and install ntopng:
apt update && apt install ntopng -y
Step 6: Check ntopng Service
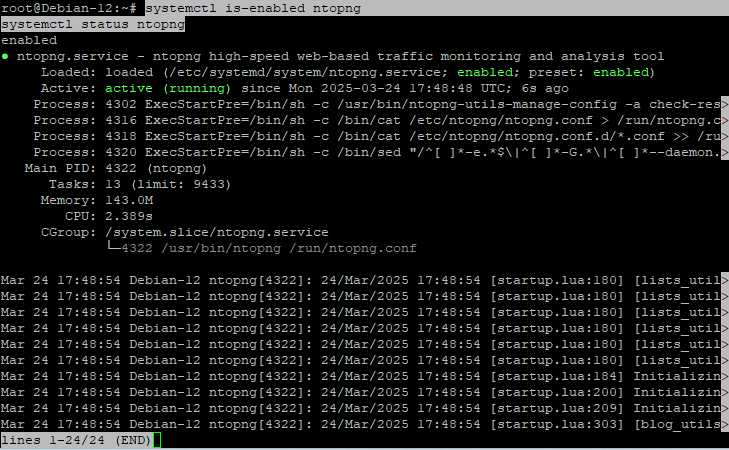
Ensure the ntopng service is enabled:
systemctl is-enabled ntopng
Verify that it is running:
systemctl status ntopng
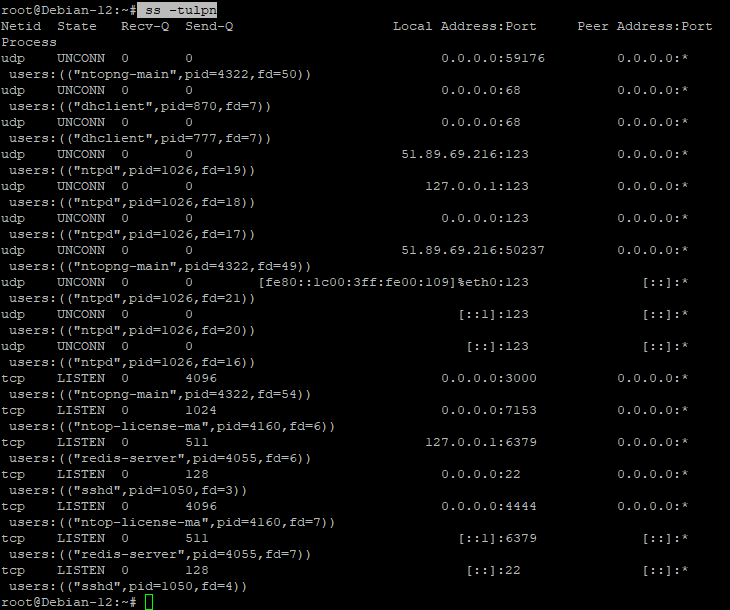
You can also check listening ports:
ss -tulpn
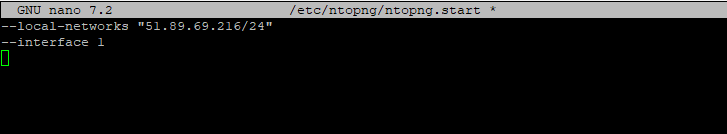
Step 7: Configure ntopng
To define which local network to monitor and which interface to use, edit the config file:
nano /etc/ntopng/ntopng.start
Example config:
--local-networks "192.168.1.0/24"
--interface 1
Step 8: Restart the Service
Apply changes by restarting ntopng:
systemctl restart ntopng

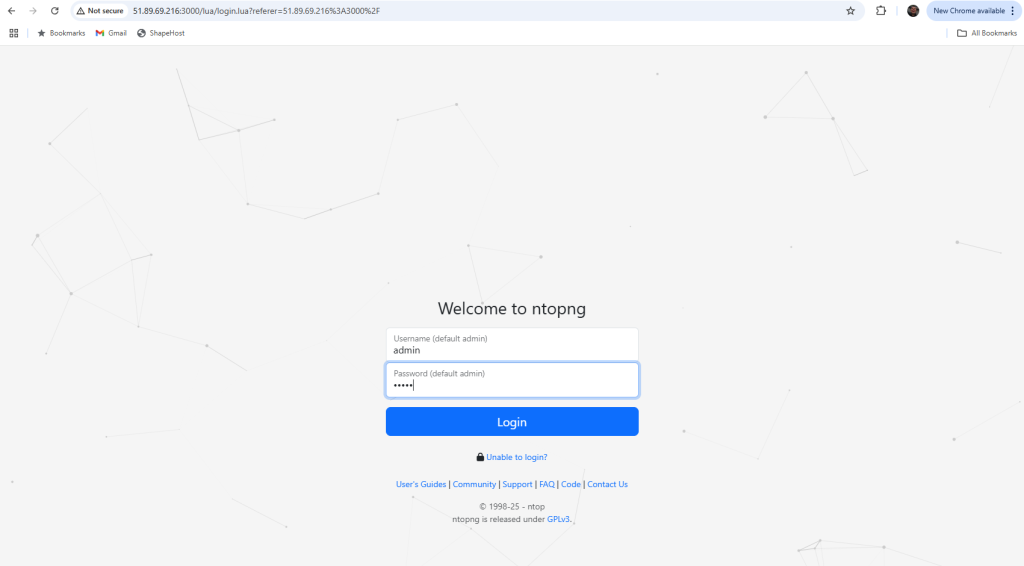
Step 9: Access the ntopng Web Interface
Open your browser and go to:
http://your-server-ip:3000
Log in using the default credentials:
- Username:
admin - Password:
admin
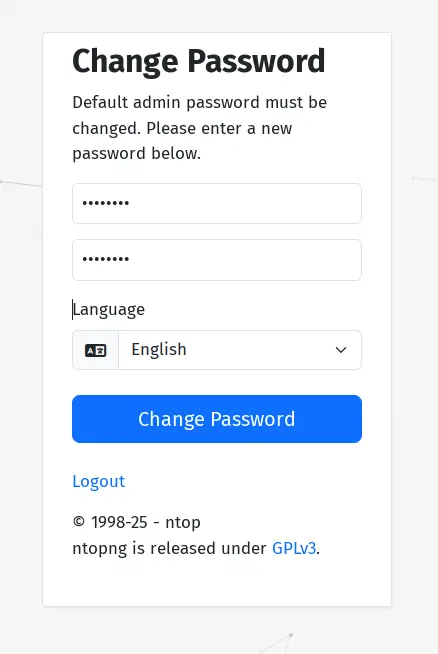
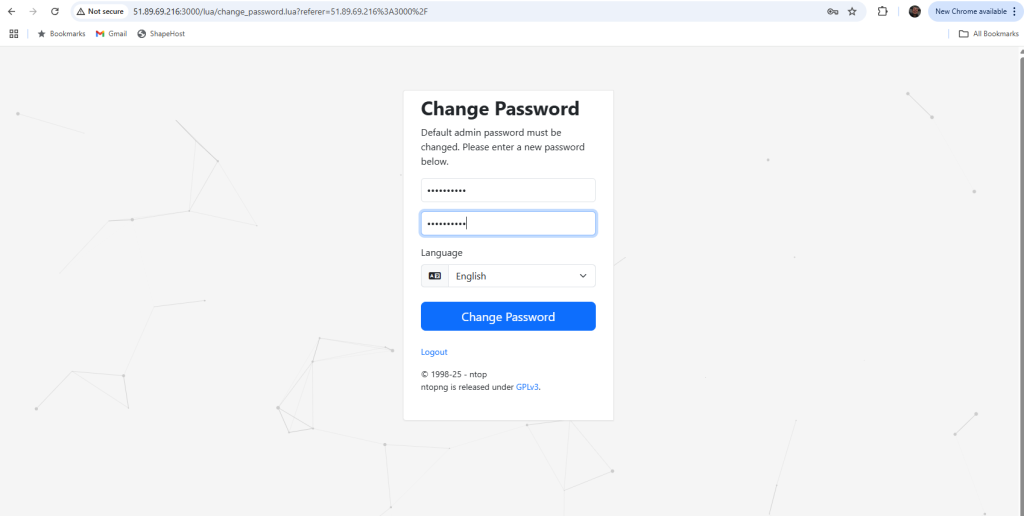
You’ll be prompted to set a new password on first login.
Now, you’ll be asked to change the default Ntopng password. Make sure to use the strong password for the Ntopng dashboard authentication.
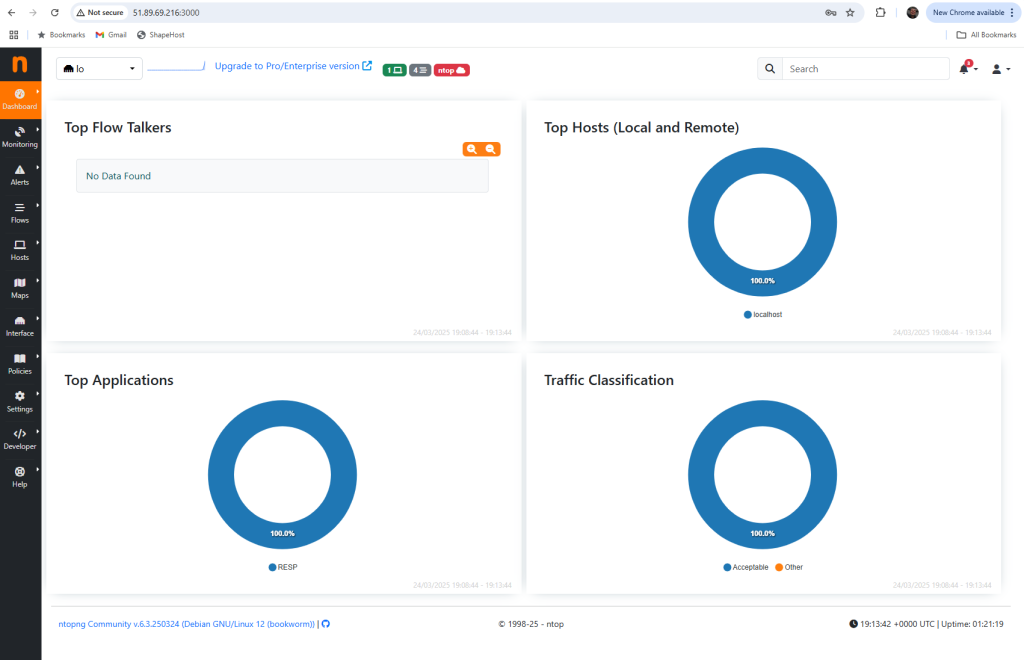
If successful, you’ll see the Ntopng dashboard like the following:
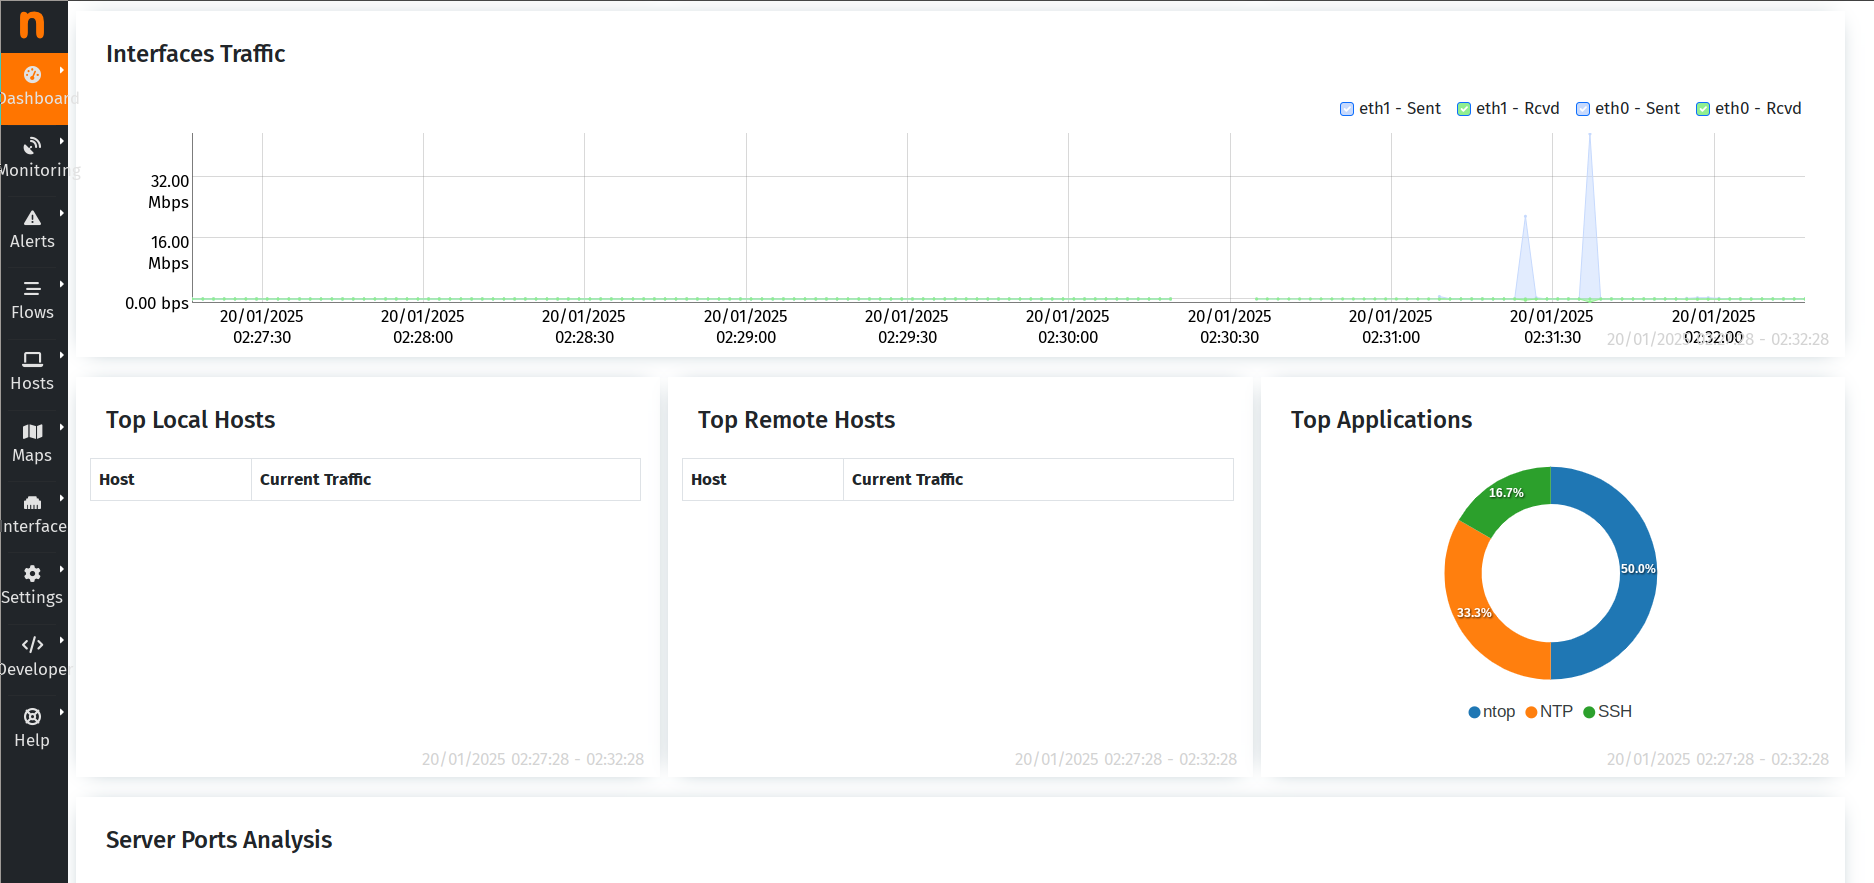
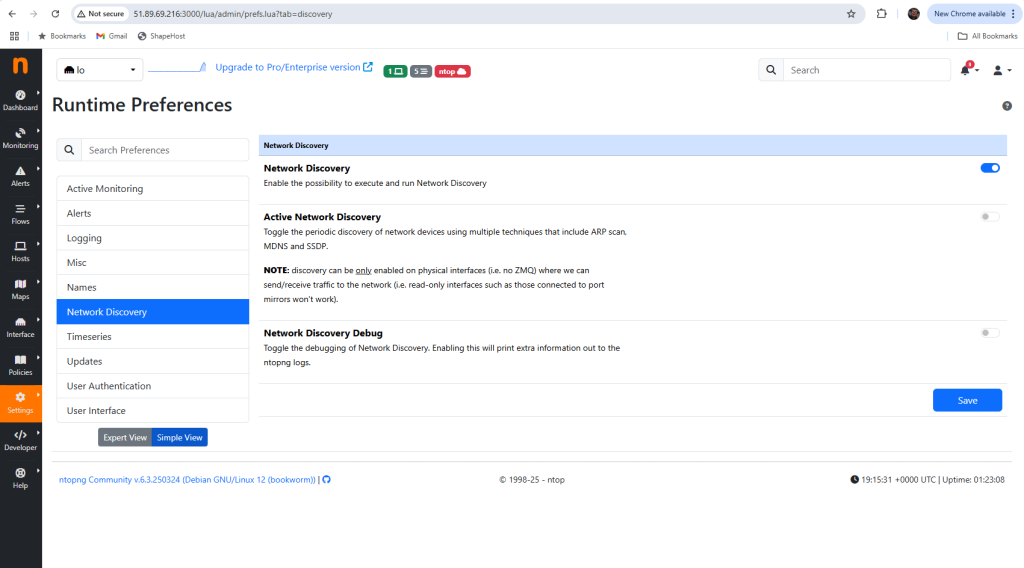
Click on the ‘Settings > Preferences‘ and select ‘Network Discovery‘.
Turn on the ‘Network Discovery‘ and click ‘Save‘.
For the best performance and uptime, deploy ntopng on a Shape.Host Cloud VPS, optimized for speed and scalability.