What is Sysdig?
Sysdig is an open-source system monitoring, troubleshooting, and security tool designed to provide deep visibility into Linux systems and containerized applications. Unlike traditional monitoring tools that focus on CPU, memory, and network usage at a high level, Sysdig captures system calls and kernel interactions, allowing for detailed performance analysis, forensic investigation, and real-time monitoring.
Key Features of Sysdig
- Deep Kernel-Level Visibility: Sysdig captures system calls, enabling users to inspect process activities, file system interactions, and network connections.
- Container Monitoring: Sysdig integrates seamlessly with Docker and Kubernetes, providing container-specific insights.
- Real-Time and Historical Analysis: Supports both live monitoring and trace file recording for later analysis.
- Security and Compliance: Sysdig Secure offers runtime security, anomaly detection, and compliance monitoring.
- Custom Filters and Events: Users can define filters to analyze specific system activities.
- CLI and GUI Support: Command-line-based monitoring and compatibility with Sysdig Inspect GUI.
Sysdig vs. Other System Monitoring Services
| Feature | Sysdig | Prometheus | Nagios | Netdata | Htop |
|---|---|---|---|---|---|
| Kernel-Level Monitoring | ✅ Yes | ❌ No | ❌ No | ❌ No | ❌ No |
| Container Monitoring | ✅ Yes | ✅ Yes | ❌ No | ✅ Yes | ❌ No |
| Real-Time Analysis | ✅ Yes | ✅ Yes | ✅ Yes | ✅ Yes | ✅ Yes |
| Security & Intrusion Detection | ✅ Yes (Sysdig Secure) | ❌ No | ❌ No | ❌ No | ❌ No |
| Custom Metrics & Dashboards | ❌ No | ✅ Yes | ✅ Yes | ✅ Yes | ❌ No |
| Historical Data Storage | ✅ Yes | ✅ Yes | ✅ Yes | ❌ No | ❌ No |
| Resource Usage (CPU & RAM) | ✅ Yes | ✅ Yes | ✅ Yes | ✅ Yes | ✅ Yes |
| Easy to Use (CLI/GUI) | ✅ Yes (CLI & GUI) | ✅ Yes (with Grafana) | ❌ Complex | ✅ Yes | ✅ Yes |
Comparison Breakdown
- Sysdig vs. Prometheus
- Sysdig provides deeper visibility at the system call level, making it ideal for debugging and security analysis.
- Prometheus is better suited for time-series monitoring, metrics collection, and dashboard visualization (usually paired with Grafana).
- Sysdig vs. Nagios
- Nagios is primarily a host and service monitoring tool with plugin-based architecture. It excels at alerting and uptime monitoring but lacks kernel-level insights.
- Sysdig is better for real-time troubleshooting, security monitoring, and forensic analysis.
- Sysdig vs. Netdata
- Netdata focuses on real-time, high-frequency performance monitoring with a lightweight, user-friendly dashboard.
- Sysdig goes deeper into system calls and forensic analysis but does not provide a real-time web-based dashboard.
- Sysdig vs. Htop
- Htop is a simple process monitoring tool that visualizes CPU and memory usage in real time but does not offer security, logging, or historical data.
- Sysdig provides a much more detailed analysis of system activities, including process behavior and security monitoring.
Use Cases of Sysdig
- Performance Monitoring: Analyze system performance at the kernel level.
- Security & Intrusion Detection: Detect unauthorized activity and enforce runtime security policies.
- Forensic Analysis: Investigate incidents by capturing and replaying system activity.
- Containerized Environments: Monitor Docker and Kubernetes workloads with container-specific metrics.
Sysdig is a powerful and unique tool for system monitoring, security, and forensic analysis, offering deep visibility at the kernel level. While it lacks built-in dashboards like Prometheus or Netdata, its strength lies in its ability to analyze system calls and security events, making it an excellent choice for debugging, intrusion detection, and performance tuning on Debian 12 and other Linux distributions.
Step 1: Set Up Your Debian 12 Server
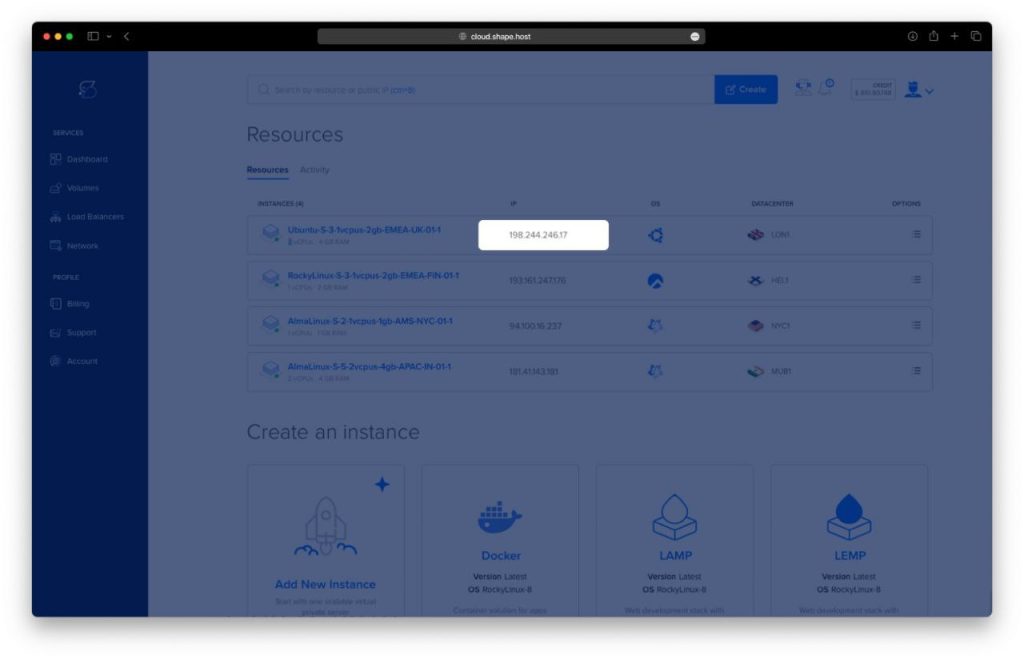
Before installing Sysdig, make sure you have a Debian 12 server up and running. If you don’t have one yet, follow these simple steps to create an instance on Shape.Host:
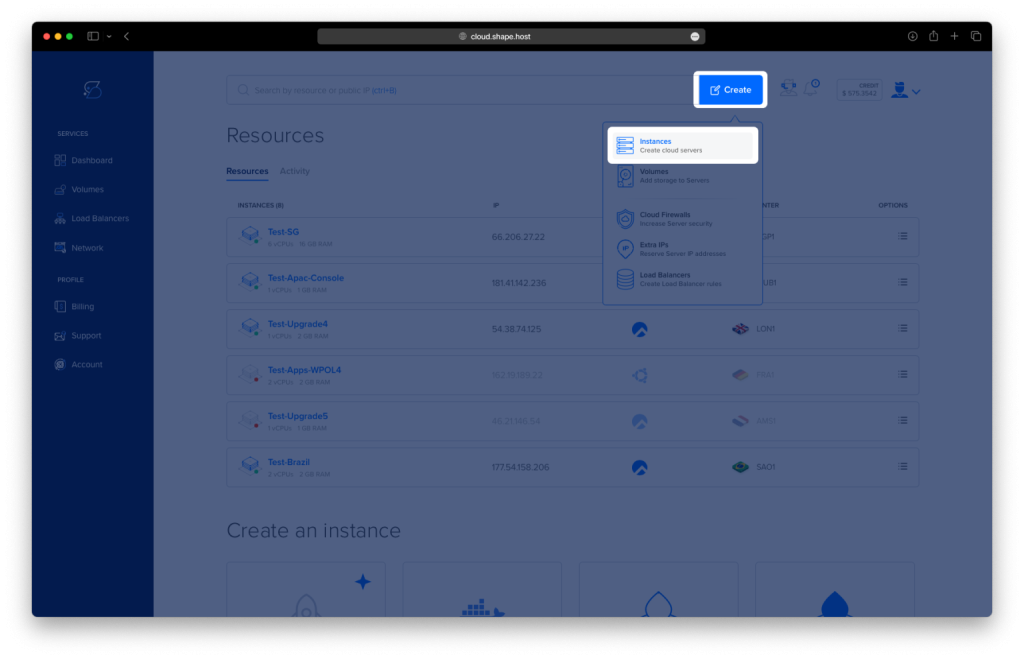
Log in to Shape.Host and access your Dashboard.
Click “Create” to set up a new server.
Select “Instances” to configure your virtual machine.
Pick a Data Center Location for optimal server response time.
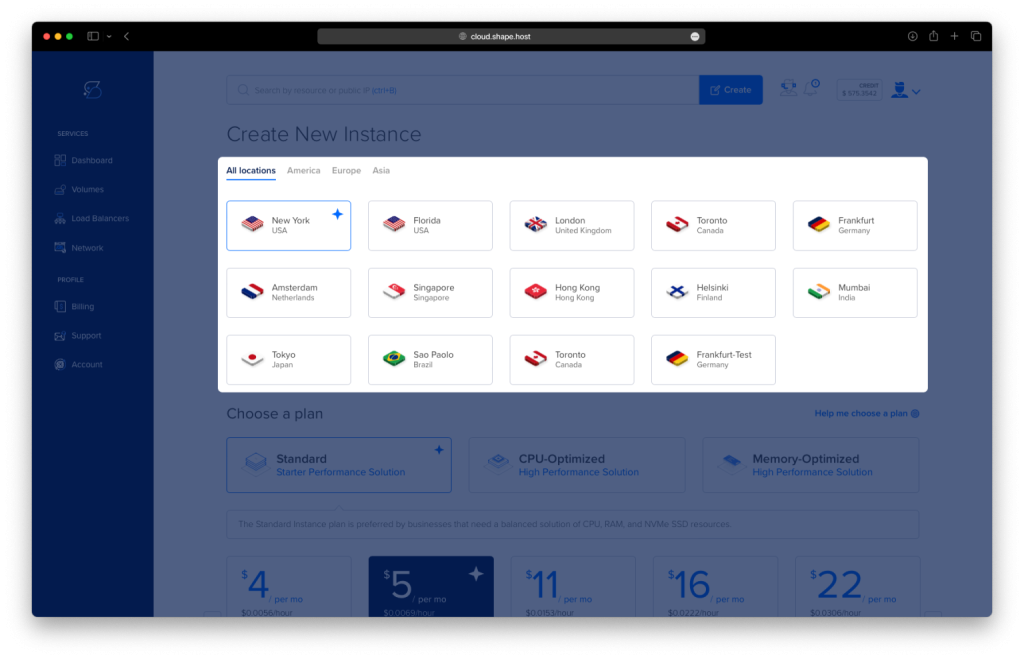
Choose a Hosting Plan based on your project’s resource requirements.
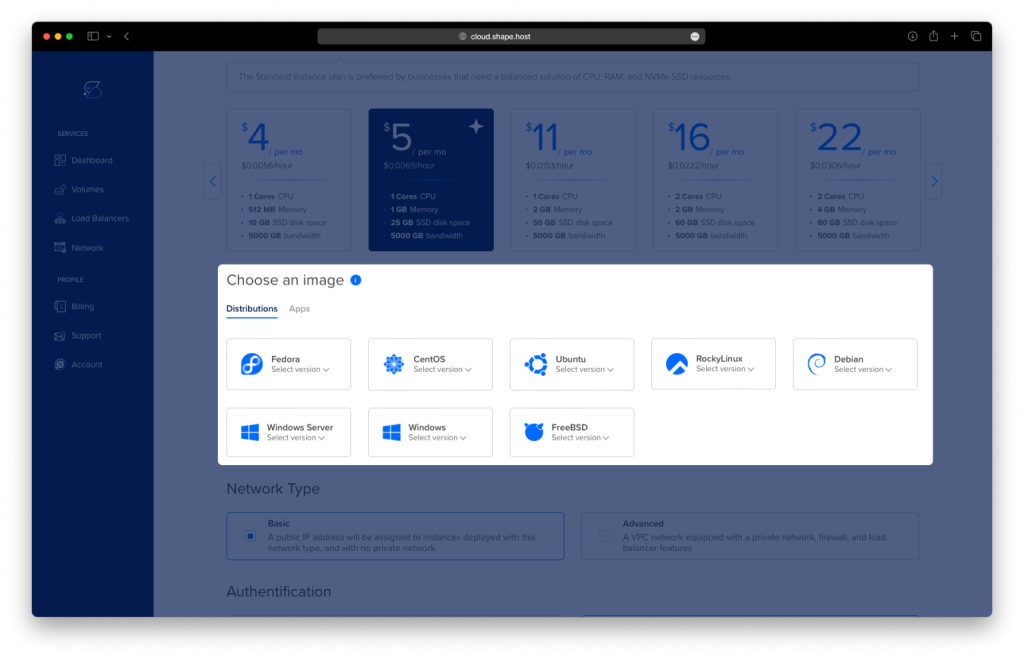
Select Debian 12 as your operating system and finalize the setup.
Deploy the Server by choosing an authentication method (SSH keys or password authentication) and clicking Create Instance.
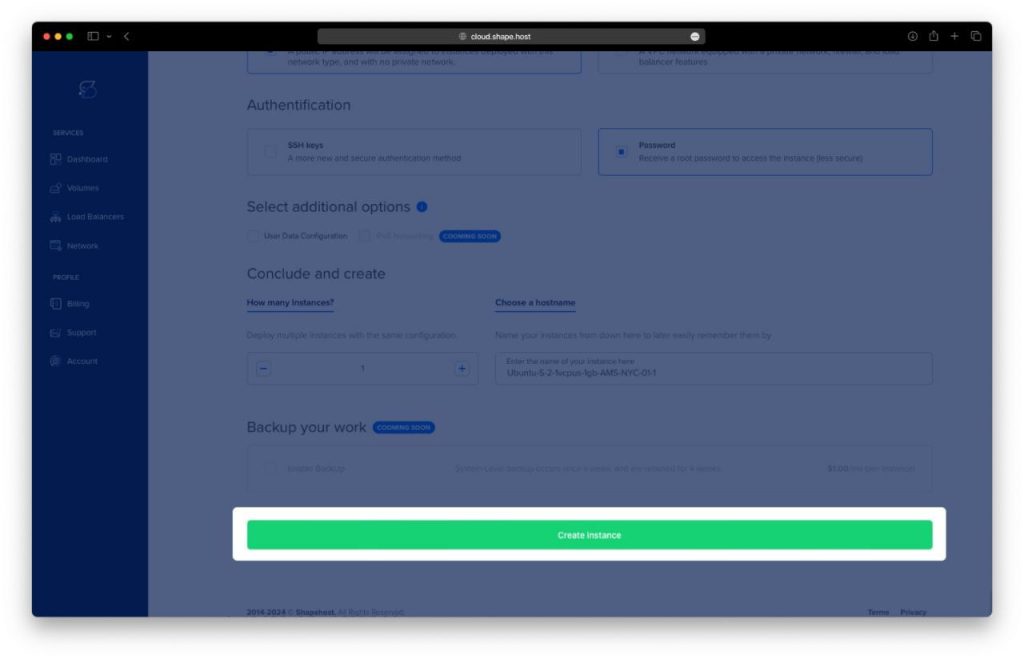
Locate Your Instance’s IP Address.
Step 2: Connect to Your Server
Once your server is deployed, you need to connect to it using SSH.
For Linux/macOS Users:
ssh root@<your_server_ip>For Windows Users: Use PuTTY, enter your server’s IP address, and establish the connection.
Step 3: Update Your System
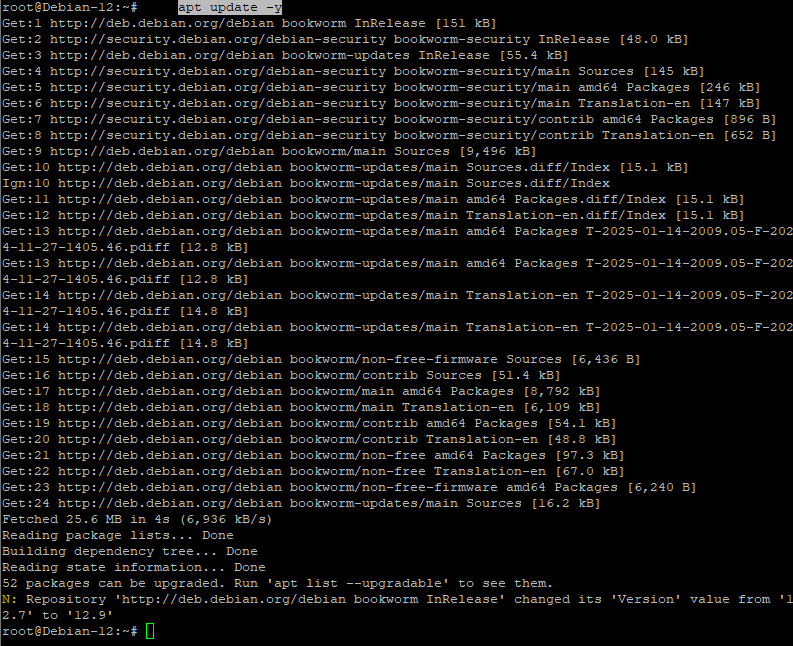
Before installing Sysdig, ensure your server is up to date by running:
apt update -y
Keeping your system updated ensures security patches and compatibility with the latest software.
Step 4: Install Sysdig on Debian 12
Step 4.1: Install Required Dependencies
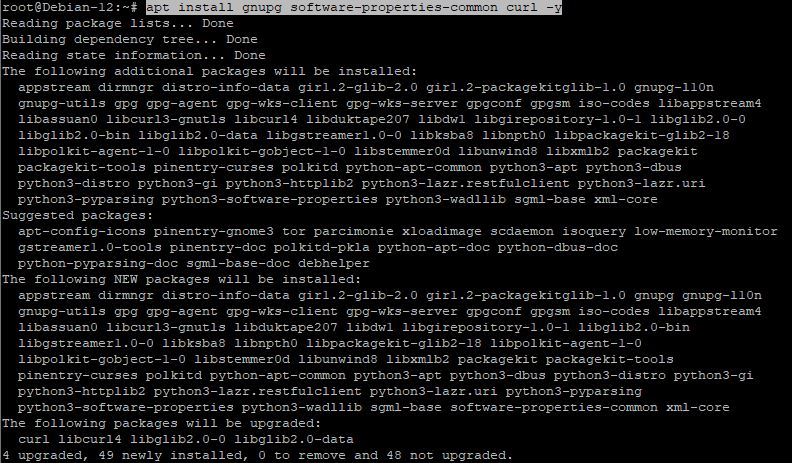
Before installing Sysdig, install essential dependencies:
apt install gnupg software-properties-common curl -y
Step 4.2: Download and Install Sysdig
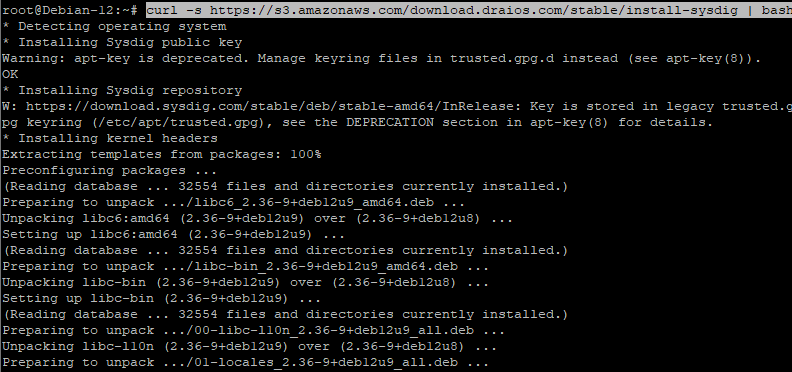
Run the following command to install Sysdig directly from the official source:
curl -s https://s3.amazonaws.com/download.draios.com/stable/install-sysdig | bash
Step 4.3: Verify the Installation
To confirm Sysdig is installed, check its version:
sysdig --version

Step 5: Getting Started with Sysdig
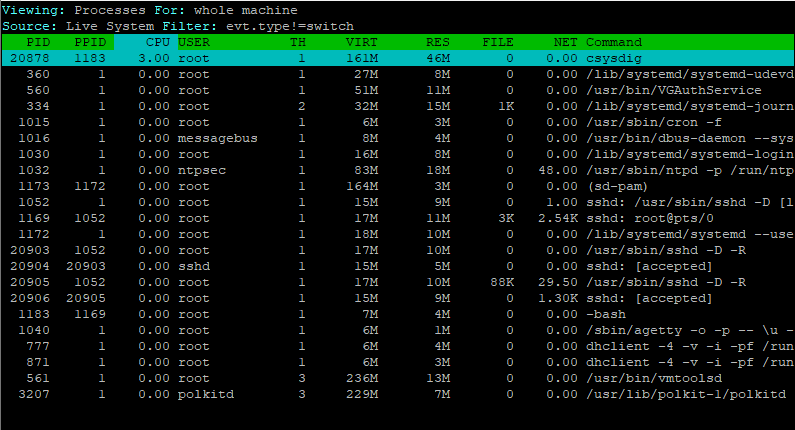
Step 5.1: Launch the Sysdig Interactive Interface
To start Sysdig’s interactive monitoring tool, run:
csysdig
This opens a real-time monitoring interface similar to htop, where you can analyze running processes, resource usage, and network activity.
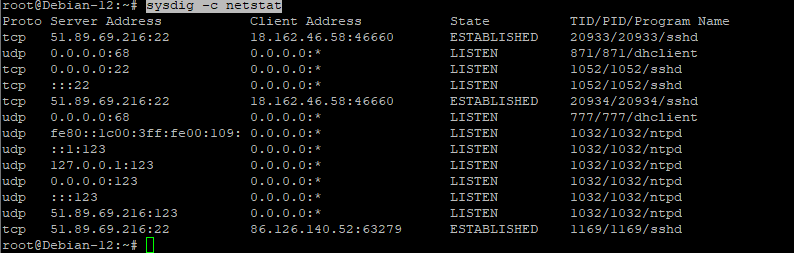
Step 5.2: Monitor Active Network Connections
To view all active network connections, use:
sysdig -c netstat
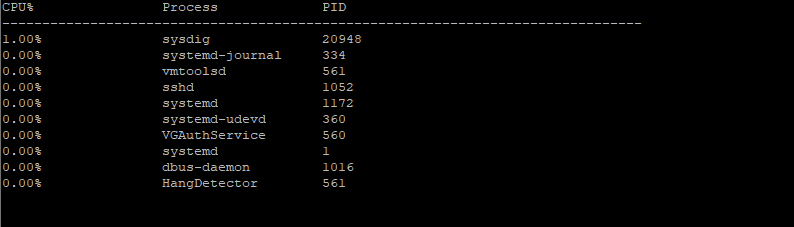
Step 5.3: Monitor CPU-Intensive Processes
To see which processes are consuming the most CPU:
sysdig -c topprocs_cpu
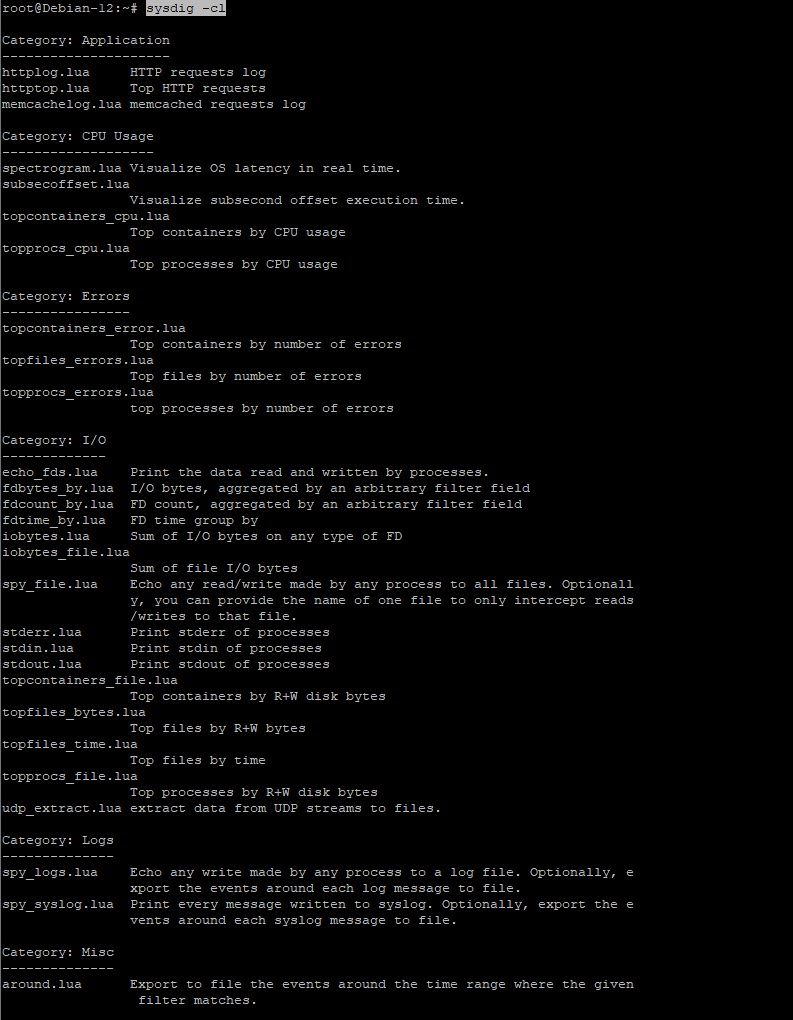
Step 5.4: List Available Sysdig Filters
Sysdig provides several built-in filters to simplify monitoring. To see all available filters, run:
sysdig -cl
Step 5.5: Capture System Events for Later Analysis
If you need to record system events for debugging, use:
sysdig -w capture_file.scap
Step 5.6: Replay a Captured Sysdig File
To analyze a previously recorded session, use:
sysdig -r capture_file.scap
Step 5.7: Monitor a Specific Process
If you want to track a specific process, such as Nginx, use:
sysdig proc.name=nginx
Step 5.8: Monitor Input/Output (I/O) Activity
To analyze which processes are using disk read/write operations:
sysdig -c iobytes
Step 5.9: Track HTTP Requests
To log HTTP requests processed by the system:
sysdig -c httplog
You have successfully installed Sysdig on Debian 12 and explored its essential monitoring features.
- Sysdig provides a deep insight into system activity, making it a valuable tool for troubleshooting and performance monitoring.
- With its powerful filtering capabilities, you can track network connections, CPU usage, and process activity efficiently.
For an optimized and secure hosting experience, consider deploying Sysdig on Shape.Host Cloud VPS, designed for real-time monitoring and analytics.