Zabbix Server on Ubuntu 24.04 – Enterprise Monitoring on a Modern LTS Platform
Zabbix Server is a powerful, open-source monitoring system used by enterprises and infrastructure teams to monitor network devices, servers, applications, and cloud services. When deployed on Ubuntu 24.04 LTS (“Noble Numbat”), Zabbix benefits from the performance, reliability, and long-term support of a modern Linux distribution with cutting-edge features.
Ubuntu 24.04 LTS as a Monitoring Host
Ubuntu 24.04 includes:
- Linux Kernel 6.8: Offers strong performance, scalability, and support for modern hardware.
- Systemd 255: Provides advanced service management and journal logging.
- AppArmor: Enables security profiles for the Zabbix daemon and web components.
- PHP 8.3 and PostgreSQL 16/MySQL 8.x: Fully supported backends for the Zabbix web interface and server.
- Apache 2.4.58 and NGINX 1.24+: Compatible web servers for serving the Zabbix frontend.
Ubuntu’s LTS status ensures stability, security updates, and long-term maintenance for Zabbix deployments through 2029.
Zabbix Server Architecture
Zabbix Server is the core component responsible for collecting and processing monitoring data. It includes the following architectural elements:
- Zabbix Server: Core daemon that handles data collection, alerting, and communication with agents and proxies.
- Zabbix Frontend: Web-based interface (PHP-based) for configuration, visualization, and reporting.
- Zabbix Agent: Installed on target systems to gather performance metrics and send data to the server.
- Zabbix Proxy (optional): Used in distributed setups to collect data from remote environments and reduce load on the main server.
- Database Backend: Stores metrics, configurations, events, and historical data. Compatible with PostgreSQL, MySQL/MariaDB, and Oracle.
Ubuntu 24.04 supports all dependencies for a full-featured Zabbix setup, including SNMP tools, fping, and IPMI utilities.
Key Features of Zabbix on Ubuntu 24.04
- High-performance, scalable data collection
- Auto-discovery of hosts and network devices
- Built-in support for SNMP, IPMI, JMX, HTTP, and agent-based monitoring
- Custom script execution and remote command triggering
- Flexible alerting with escalation rules and media types
- Data visualization with graphs, maps, and dashboards
- HA support and database partitioning for large deployments
- Built-in support for distributed monitoring using proxies
Ubuntu’s package ecosystem simplifies the deployment and operation of each Zabbix component, especially when using the official Zabbix APT repository.
Monitoring Capabilities
Zabbix is suitable for:
- Infrastructure monitoring (servers, switches, routers)
- Cloud monitoring (AWS, Azure, GCP with native templates)
- Application monitoring (databases, web servers, container runtimes)
- Log file monitoring
- Database performance metrics
- Web application health (via HTTP checks and web scenarios)
Using templates and macros, Zabbix automates configuration and integrates easily into DevOps pipelines.
Performance & Scalability Considerations
Zabbix Server on Ubuntu 24.04 benefits from:
- Improved I/O throughput (due to newer kernel and filesystem support)
- Better process isolation using control groups (cgroups v2)
- Efficient service management via systemd
- PHP 8.3 improvements for frontend responsiveness
- MySQL 8.0 or PostgreSQL 16 compatibility for large datasets
Large deployments may use partitioned databases, proxy nodes, and tuned worker processes (StartPollers, StartTrappers, StartDiscoverers) to scale efficiently.
Security Considerations
Ubuntu 24.04 provides secure defaults and kernel-level security features that work well with Zabbix:
| Security Feature | Benefit to Zabbix Server |
|---|---|
| AppArmor | Isolates Zabbix services and PHP frontend |
| FirewallD / UFW | Manages access to ports 10050 (agent) and 10051 (server) |
| HTTPS via NGINX | Secure access to the web interface |
| Auditd | Tracks changes to Zabbix configuration files |
| Strong database access control | PostgreSQL/MySQL can be hardened with roles and TLS |
Integration Ecosystem
Zabbix supports integration with:
- Alerting tools (Slack, Telegram, Microsoft Teams, Email, Webhooks)
- Automation platforms (Ansible, Puppet, Terraform via API or triggers)
- CMDB systems (i-doit, NetBox)
- ITSM tools (Jira, ServiceNow)
- Logging platforms (Graylog, ELK)
The Zabbix API (JSON-RPC) enables scripting and third-party integration for dashboards, auto-scaling, or incident response.
Comparison with Other Monitoring Solutions
| Feature | Zabbix | Prometheus | Nagios Core |
|---|---|---|---|
| Architecture | Centralized or distributed | Decentralized (pull) | Centralized with plugins |
| Alerting | Built-in with escalations | External (Alertmanager) | Email/SMS plugins |
| Visualization | Web frontend + maps | Grafana | Minimal |
| Data Retention | Long-term via DB | Short-term (TSDB) | Configurable |
| API | Full CRUD via JSON-RPC | Read-only HTTP API | Limited |
| Agent support | Zabbix Agent (v1 & v2) | Node Exporter | NRPE, SNMP |
Zabbix is preferred in environments requiring a unified platform with rich visualization, alerting, and historical data, especially in traditional IT, telecom, and enterprise datacenters.
Step 1: Set Up a Server Instance on Shape.Host
To install Zabbix, start with a clean Ubuntu 24.04 server. Shape.Host offers high-performance VPS solutions tailored for monitoring and infrastructure management tasks.
Launch a VPS on Shape.Host:
Visit https://shape.host and log in.
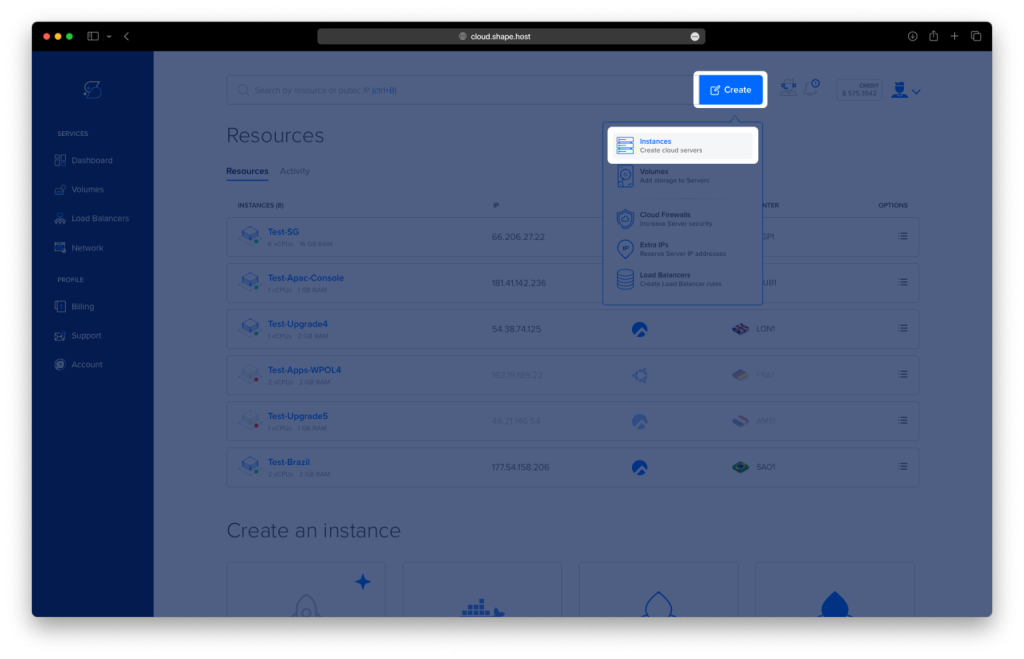
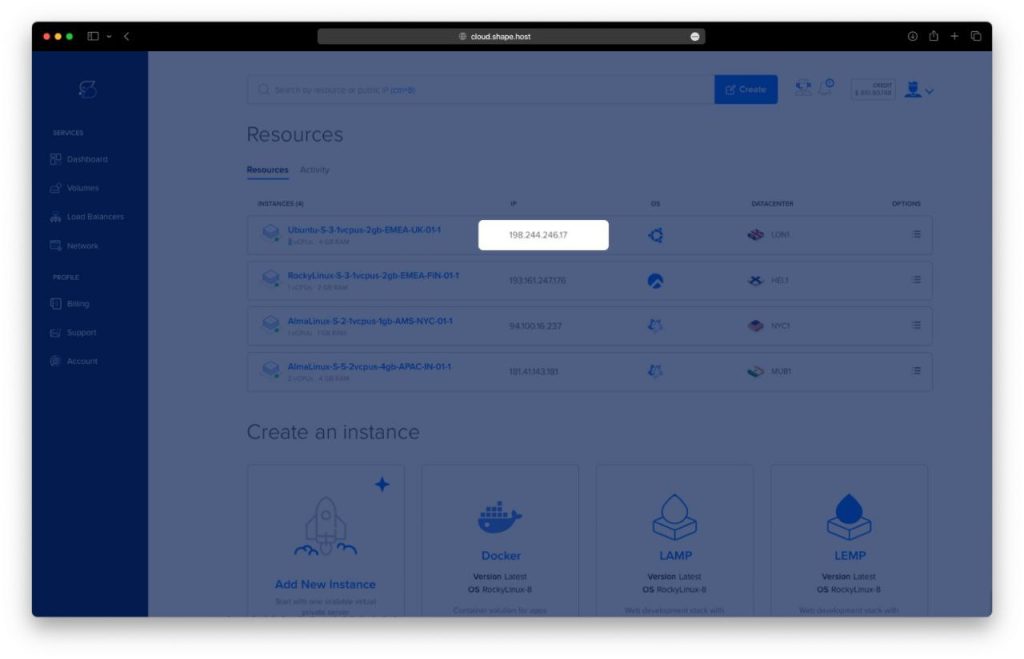
In the dashboard, click “Create”.
Select “Instance” as your resource type.
Choose a data center location closest to your users.
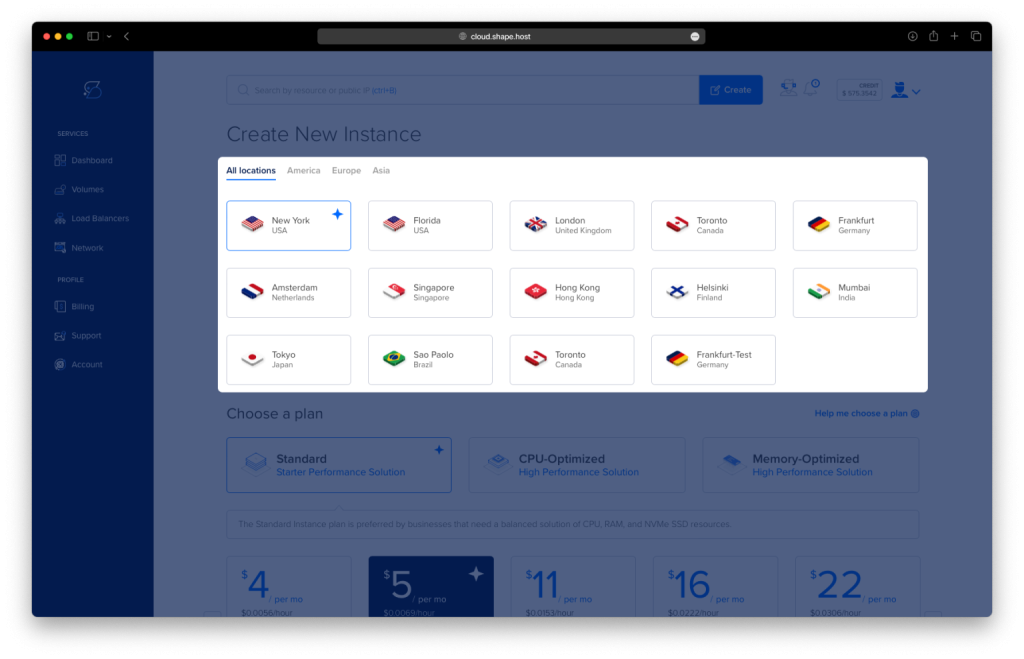
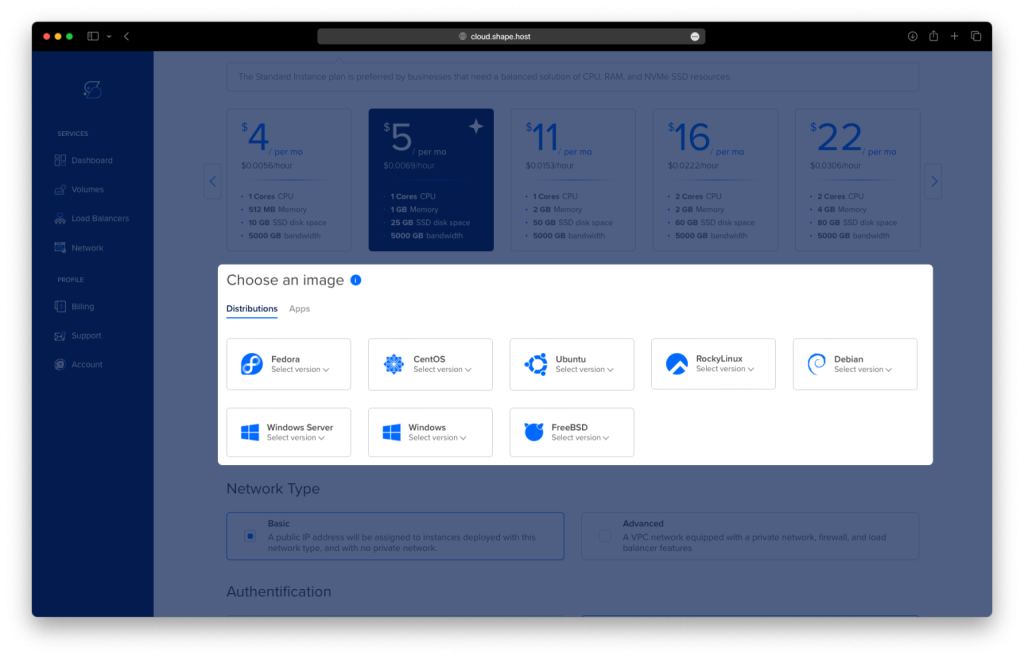
Select Ubuntu 24.04 (64-bit) as the operating system.
Pick a plan with at least 2 CPUs, 2 GB RAM, and 20 GB SSD.
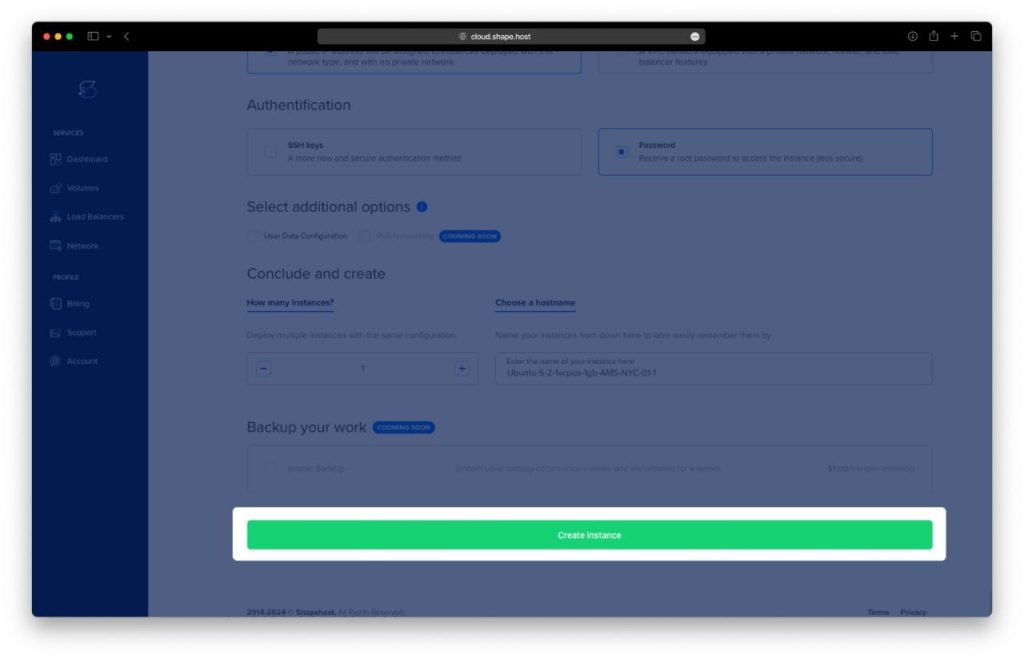
Click “Create Instance” and wait for it to provision.
Copy your server IP address from the Resources section.
Connect to Your Instance via SSH
On Linux/macOS:
ssh root@your_server_ip
On Windows (using PuTTY):
- Download PuTTY from https://www.putty.org.
- Enter your server’s IP in the Host Name field.
- Set port to
22and connection type toSSH. - Click Open and log in as
root.
Step 2: Install Apache, MariaDB, PHP, and Dependencies
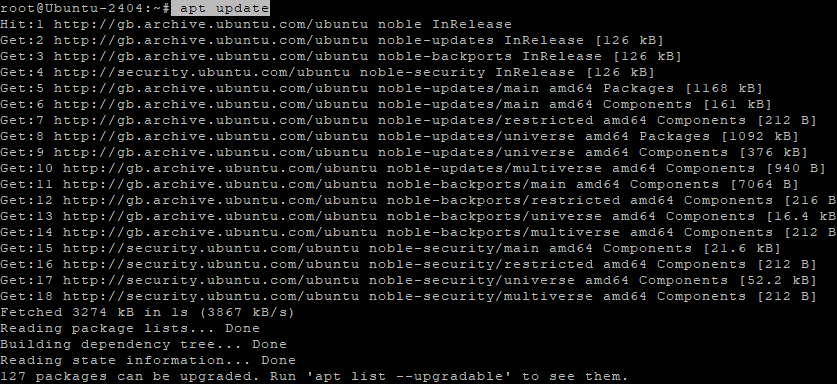
1. Update system packages:
apt update
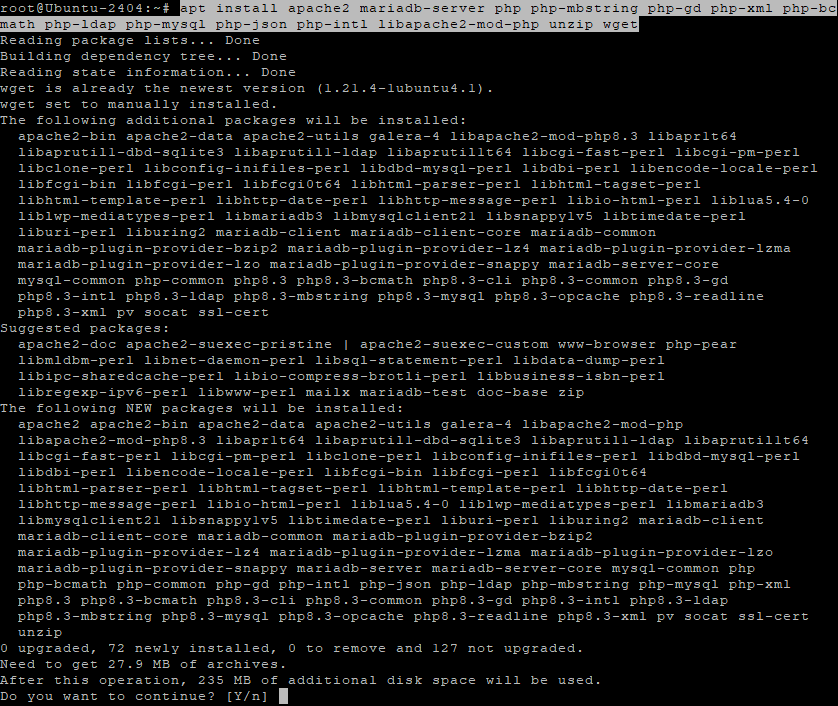
2. Install required services and PHP extensions:
apt install apache2 mariadb-server php php-mbstring php-gd php-xml php-bcmath php-ldap php-mysql php-json php-intl libapache2-mod-php unzip wget
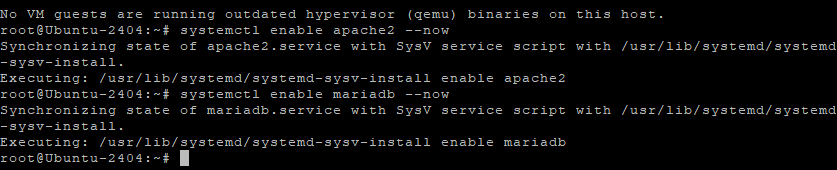
3. Enable and start Apache and MariaDB:
systemctl enable apache2 --now
systemctl enable mariadb --now
Step 3: Secure and Configure the Database
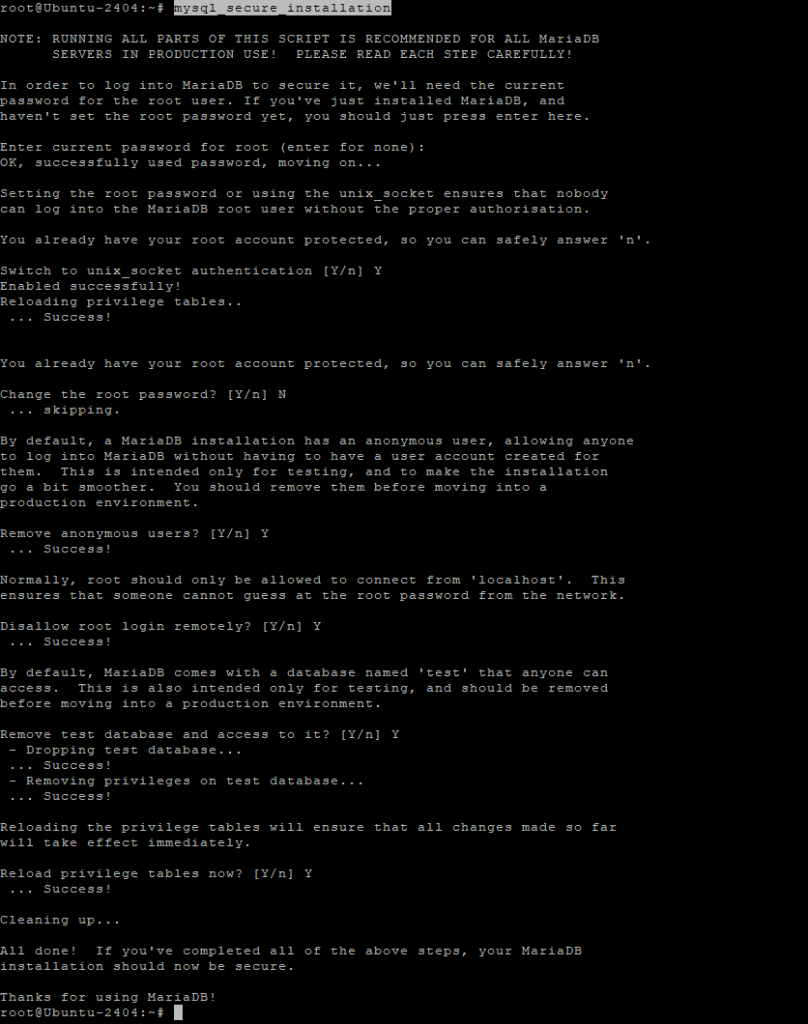
1. Run the secure MariaDB script:
mysql_secure_installation
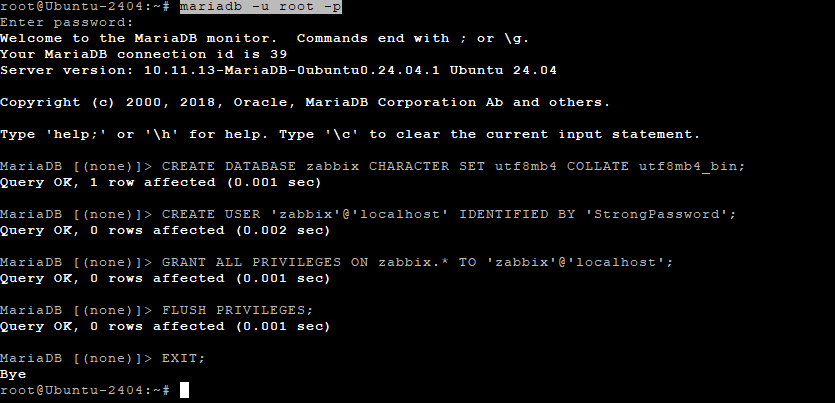
2. Log into the MariaDB shell:
mariadb -u root -p
Inside the shell, create the Zabbix database and user:
CREATE DATABASE zabbix CHARACTER SET utf8mb4 COLLATE utf8mb4_bin;
CREATE USER zabbix@localhost IDENTIFIED BY 'StrongPassword';
GRANT ALL PRIVILEGES ON zabbix.* TO zabbix@localhost;
FLUSH PRIVILEGES;
EXIT;
Step 4: Install and Configure Zabbix Server
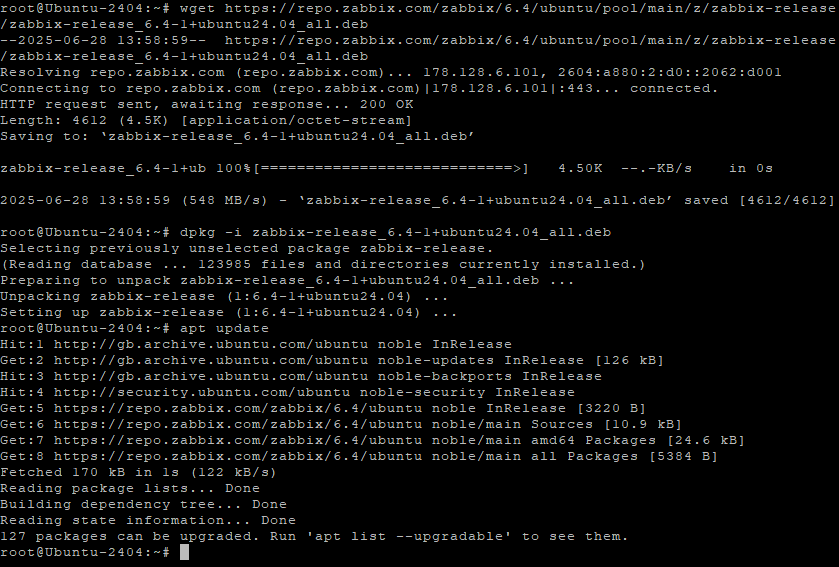
1. Download the Zabbix 6.4 repository:
wget https://repo.zabbix.com/zabbix/6.4/ubuntu/pool/main/z/zabbix-release/zabbix-release_6.4-1+ubuntu24.04_all.deb
2. Install the repository:
dpkg -i zabbix-release_6.4-1+ubuntu24.04_all.deb
apt update
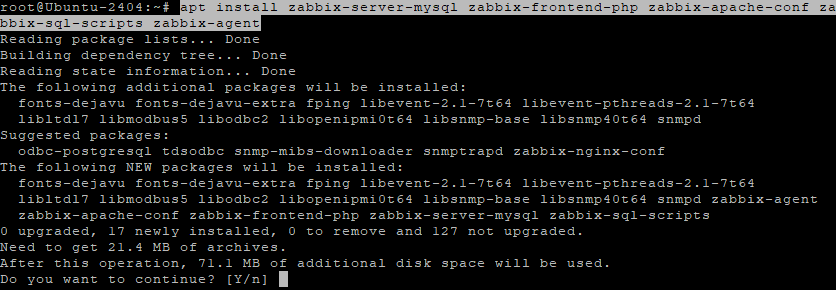
3. Install Zabbix components:
apt install zabbix-server-mysql zabbix-frontend-php zabbix-apache-conf zabbix-sql-scripts zabbix-agent
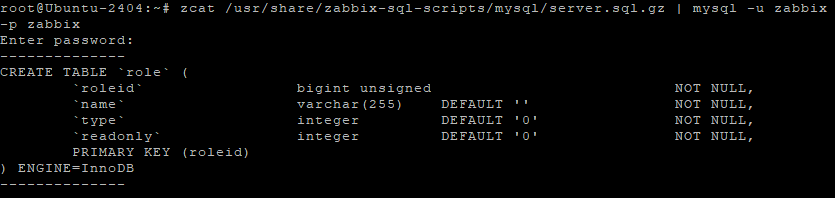
Step 5: Import Initial Database Schema
Import the database schema into MariaDB:
zcat /usr/share/zabbix-sql-scripts/mysql/server.sql.gz | mysql -u zabbix -p zabbix
Enter the StrongPassword when prompted.
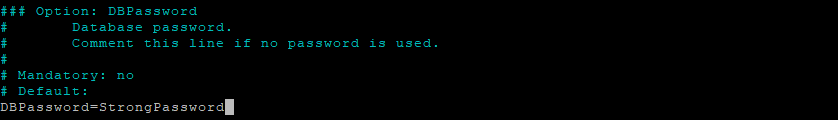
Step 6: Configure Zabbix Server
1. Edit Zabbix server configuration:
nano /etc/zabbix/zabbix_server.conf
Find and set:
DBPassword=StrongPassword
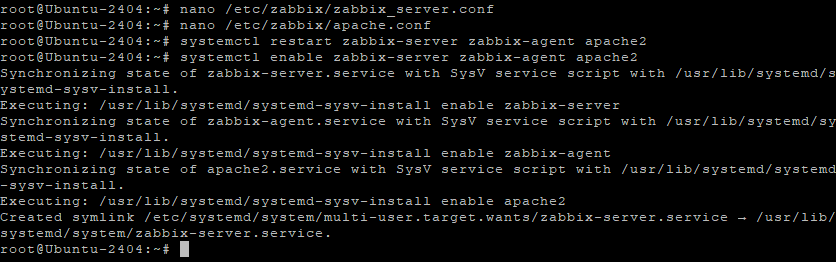
2. Set PHP timezone for the Zabbix frontend:
nano /etc/zabbix/apache.conf
Add or modify:
php_value date.timezone Europe/Bucharest

Step 7: Start and Enable Zabbix Services
1. Restart all services:
systemctl restart zabbix-server zabbix-agent apache2
2. Enable services to start on boot:
systemctl enable zabbix-server zabbix-agent apache2
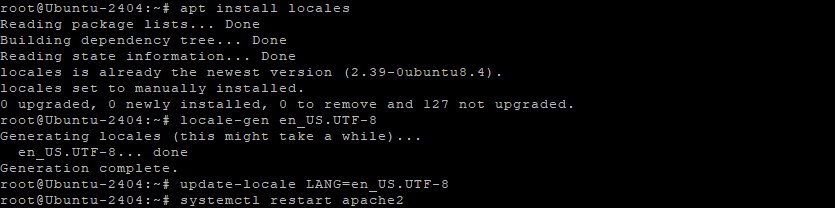
Step 8: Set Locale (Optional but Recommended)
1. Install and configure system locale:
apt install locales
locale-gen en_US.UTF-8
update-locale LANG=en_US.UTF-8
systemctl restart apache2
Step 9: Access Zabbix Web Interface
Open your browser and navigate to:
http://your-server-ip/zabbix
Follow the web installer to complete setup. You’ll be prompted to provide:
- Database credentials (user:
zabbix, password:StrongPassword) - Timezone
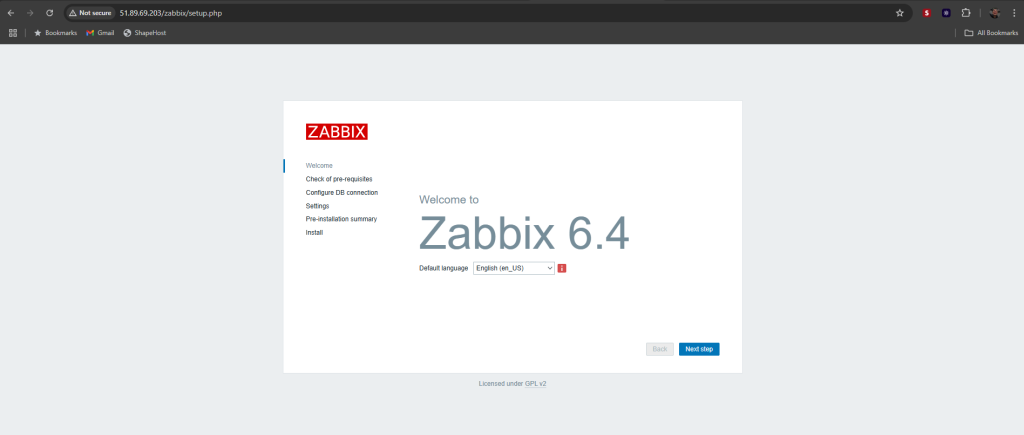
- Welcome Page
- This is the Welcome screen of the Zabbix 6.4 web-based installation wizard.
- Purpose: This is the first step of the installation interface, where you begin setting up the Zabbix frontend through a browser.
- Language Selection: Here, you can choose the default language for the installation and interface. The default option shown is English (en_US).
- Navigation:
- On the left side, you can see the upcoming steps:
Check of pre-requisites,Configure DB connection,Settings,Pre-installation summary, andInstall. - The “Next step” button at the bottom right begins the setup process.
- On the left side, you can see the upcoming steps:
- Once the language is selected, click Next step to proceed to the requirements check.
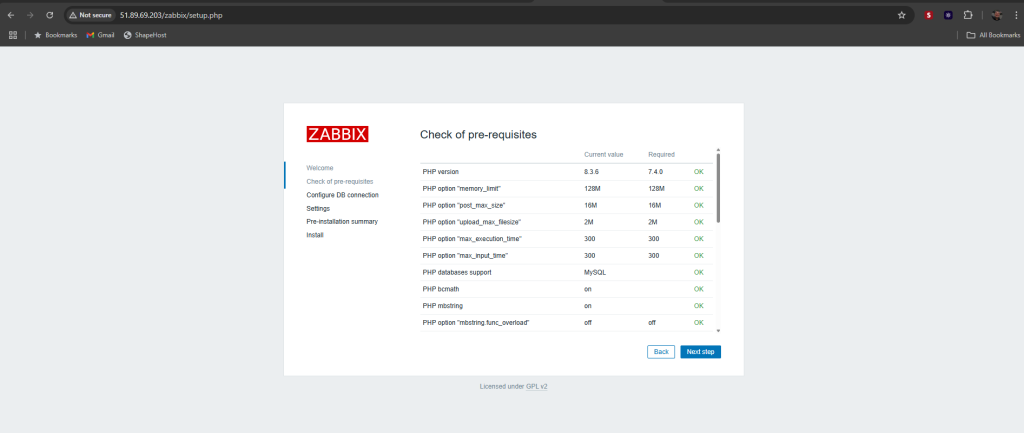
Check of Pre-requisites
This screen shows the system requirements check that Zabbix performs before continuing with the installation.
- Purpose: It verifies whether the PHP environment on the server meets the minimum requirements needed by Zabbix.
- Key elements displayed:
- PHP version: The installer confirms that the installed version (
8.3.6) is compatible, as it exceeds the minimum required (7.4.0). - PHP configuration options (e.g.,
memory_limit,post_max_size,upload_max_filesize,max_execution_time, etc.) are compared against Zabbix’s requirements. - PHP extensions such as
bcmath,mbstring, andMySQLsupport are also checked.
- PHP version: The installer confirms that the installed version (
- Status: Each line ends with
OK, indicating that your server meets all the necessary prerequisites.
Once everything is marked OK, you can proceed confidently by clicking Next step.
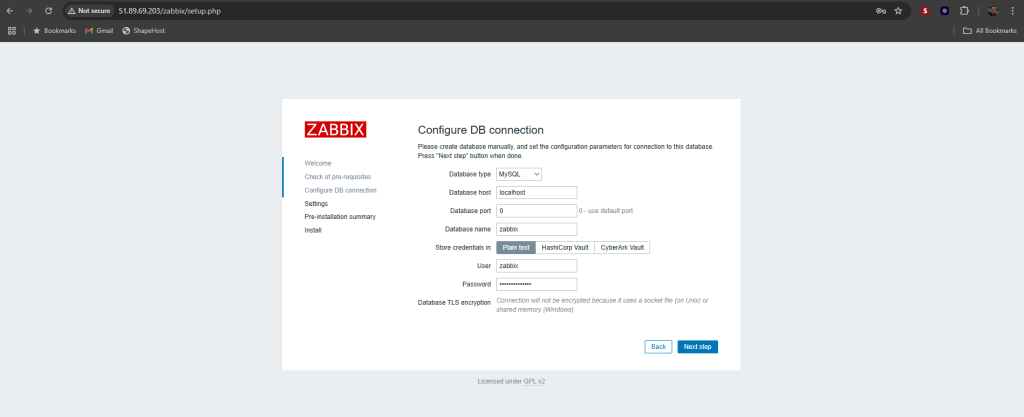
Configure DB Connection
This screen is used to configure the connection to the Zabbix database, which must be created manually before reaching this step.
Fields explained:
- Database type: Choose the type of database Zabbix will use. Here, MySQL is selected (MariaDB is compatible).
- Database host: Typically
localhostif the database is on the same server as Zabbix. - Database port: Set to
0to use the default port for MySQL (3306). - Database name: Enter the name of the database you created for Zabbix — in this case, it’s
zabbix. - Store credentials in: Choose how to store database credentials. By default, Plain text is selected, but you can use HashiCorp Vault or CyberArk Vault for better security.
- User: The MySQL user with permissions to the
zabbixdatabase. - Password: The password associated with the database user.
⚠️ Note: If the connection uses a socket file or shared memory, TLS encryption will not be used — this is mentioned below the form.
Once all fields are filled correctly, click Next step to proceed with the installation.
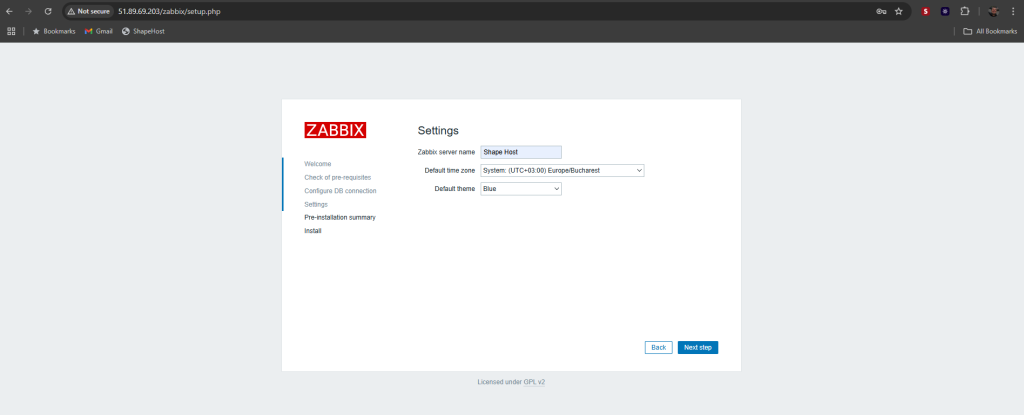
Settings
This screen lets you define general frontend settings for your Zabbix installation.
Fields explained:
- Zabbix server name: This name will be displayed in the Zabbix dashboard. In this example, it’s set to Shape Host — useful for identifying your instance if you manage multiple installations.
- Default time zone: Choose the default time zone for the web interface. Here, it’s correctly set to (UTC+03:00) Europe/Bucharest, which ensures that all time-based data and logs will align with the selected region.
- Default theme: Sets the default visual theme for the web UI. The default option here is Blue, but other themes (like Dark or High-contrast) are also available later in user settings.
Click Next step to review the final summary before completing the installation.
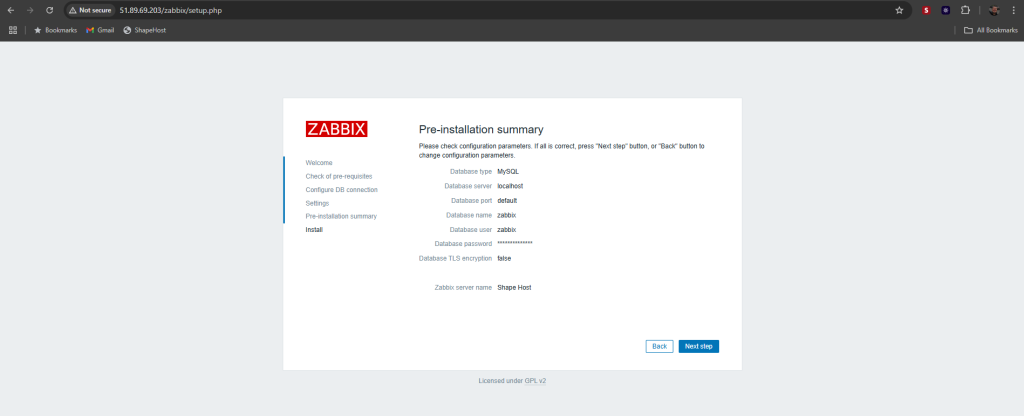
Pre-installation Summary
This screen provides a final review of all configuration settings before Zabbix completes the installation.
Summary of displayed values:
- Database type:
MySQL– confirms that Zabbix will use MySQL/MariaDB as the backend. - Database server:
localhost– indicates the database is hosted on the same machine as the Zabbix frontend. - Database port:
default– default port 3306 will be used. - Database name:
zabbix– matches the manually created database. - Database user:
zabbix– the MySQL user with appropriate privileges. - Database password: hidden for security but already filled in.
- Database TLS encryption:
false– encryption is not enabled; this is typical for local socket or shared memory connections. - Zabbix server name:
Shape Host– will be displayed in the frontend dashboard.
✅ If all these settings are correct, click Next step to start the final installation process.
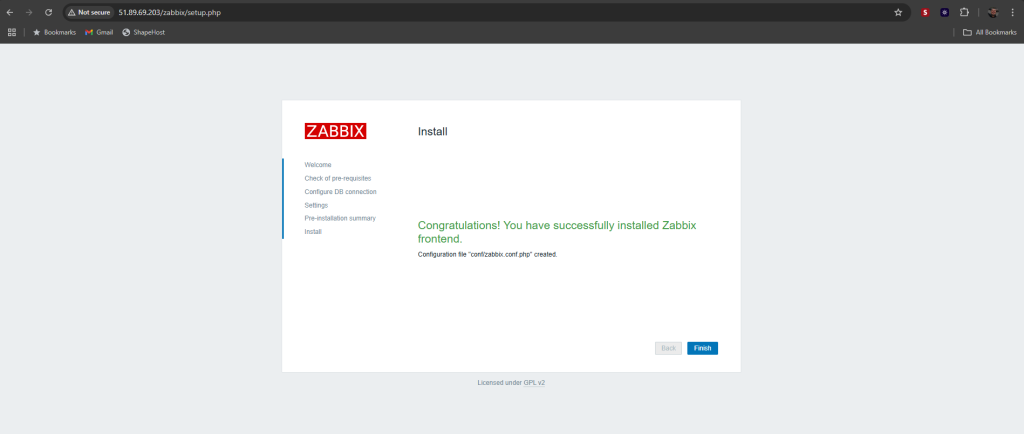
Install Complete
This is the final screen of the Zabbix installation wizard, confirming that the setup has completed successfully.
Message:
✅ Congratulations! You have successfully installed Zabbix frontend.
- The system has generated the required configuration file:
conf/zabbix.conf.php
This file contains all the previously provided database and frontend configuration details.
Final step:
Click the Finish button to complete the process and proceed to the Zabbix login page.
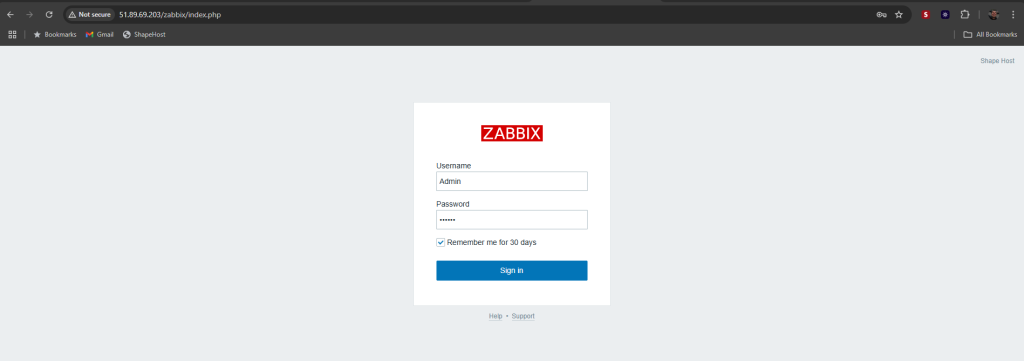
Login Page
This is the login screen for the Zabbix web interface, shown immediately after a successful installation.
Login Form Details:
- Username: By default, the admin username is
Admin(with capital “A”). - Password: The default password is
zabbix, unless changed during setup or later via the database. - Remember me for 30 days: If checked, the session will persist across browser restarts for a month.
First-time Login Tip:
Once logged in, it’s highly recommended to:
- Change the default password.
- Set up user roles and permissions if others will be managing the system.
- Start configuring hosts, items, and triggers for monitoring.
Click Sign in to access the Zabbix dashboard and begin using the monitoring platform.
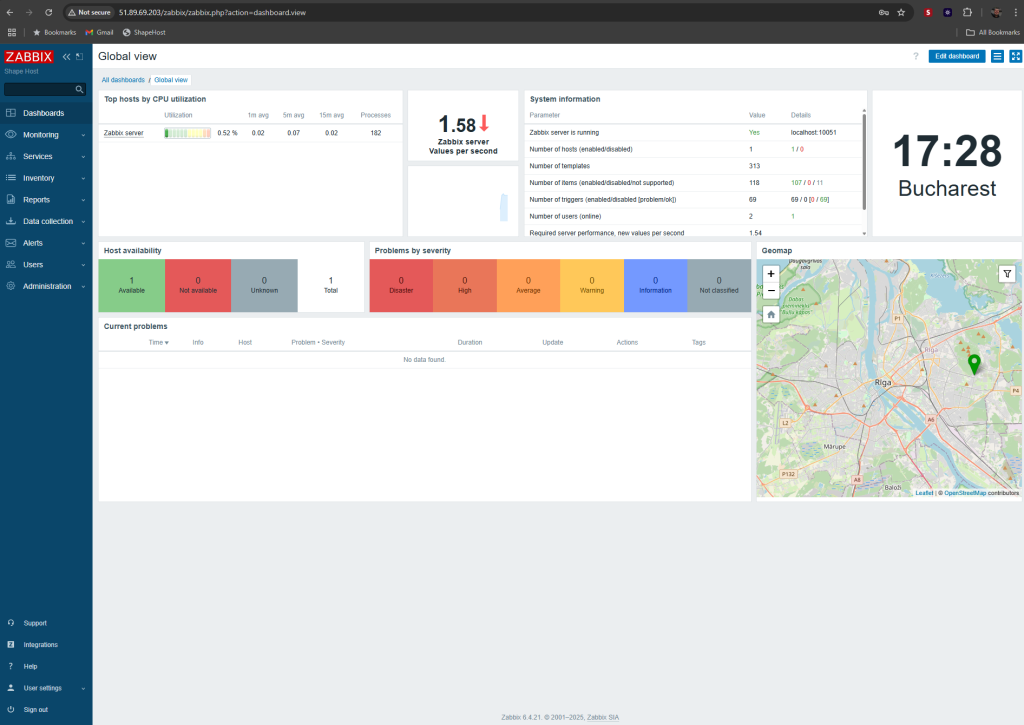
Global Dashboard View
This is the Zabbix Global View Dashboard, the main control panel after logging into the frontend. It provides a real-time overview of your monitored infrastructure.
Key Dashboard Elements:
- Top hosts by CPU utilization:
Displays performance metrics for each host. In this case,Zabbix serveris shown with live CPU usage stats. - Zabbix server values per second:
Shows the current number of incoming values per second being processed by the Zabbix server — here it’s1.58. - System information (top right panel):
- Server status: ✅ Running
- Number of hosts, templates, items, triggers, users
- Indicates performance requirements (
new values per second)
- Current time and location:
Time is displayed based on the server’s configured time zone (e.g., Bucharest). - Host availability:
Visual breakdown of host status:- 1 Available
- 0 Not available
- 0 Unknown
- Problems by severity:
Color-coded bar showing the count of issues grouped by severity level (e.g., Disaster, High, Warning). Currently, no active problems. - Geomap widget (bottom right):
Displays a host’s location using coordinates from OpenStreetMap, useful for globally distributed infrastructure. - Menu sidebar (left):
Access to Dashboards, Monitoring, Inventory, Reports, Data collection, Alerts, Users, and Administration sections.
You’ve successfully installed and configured Zabbix Server 6.4 on Ubuntu 24.04 with Apache, MariaDB, and PHP. This setup provides a powerful foundation for monitoring IT infrastructure, servers, and services.
Take your monitoring further with fast, scalable Cloud VPS from Shape.Host—the ideal environment for running tools like Zabbix.
Deploy your next project at https://shape.host.