htop on AlmaLinux 9 – Interactive System Monitoring for Enterprise Linux
htop is a powerful, interactive system monitor and process viewer for Unix-like operating systems. It’s designed to be a user-friendly, colorful, and feature-rich alternative to the traditional top command. On AlmaLinux 9, htop provides administrators and developers with real-time insights into system performance, making it an essential tool for monitoring workloads in production environments.
What Is AlmaLinux 9?
AlmaLinux 9 is a binary-compatible downstream fork of Red Hat Enterprise Linux 9 (RHEL 9). It’s a free, open-source, enterprise-grade Linux distribution offering long-term support and stability, with a focus on data center, cloud, and containerized workloads.
Because AlmaLinux follows RHEL’s package and security policies, it’s widely used by businesses and cloud service providers for mission-critical systems.
Why Use htop on AlmaLinux 9?
While AlmaLinux 9 ships with top as part of the procps-ng package, htop offers a more intuitive and efficient monitoring experience. It aligns well with AlmaLinux’s use in server and DevOps environments, providing:
| Feature in AlmaLinux 9 | Benefit for htop Usage |
|---|---|
| Kernel 5.14+ | Accurate CPU/thread monitoring for multicore CPUs |
| Systemd 250+ | Process tree integration and service management |
| SELinux (enabled by default) | Easily observe access-limited or sandboxed processes |
| Minimal server environments | Makes htop’s lightweight nature ideal |
Key Features of htop
- ✅ Real-time CPU, memory, and swap usage bars
- ✅ Process tree view (toggle with
F5) - ✅ Interactive controls: kill, renice, sort, and filter processes
- ✅ Color-coded metrics for fast readability
- ✅ Mouse support in terminal sessions
- ✅ Search (
F3) and filter (F4) - ✅ Thread-level visibility
- ✅ Custom column and meter configurations (
F2setup menu)
Common Use Cases
- Investigating performance issues (CPU spikes, memory leaks)
- Managing services and background processes
- Monitoring live system load on VPS or bare-metal servers
- Troubleshooting high-load containers or virtual machines
- Analyzing the behavior of SELinux-constrained services
In the AlmaLinux 9 ecosystem, where server roles are often minimal and performance-sensitive, htop serves as a lightweight and efficient real-time diagnostic tool.
htop vs top on AlmaLinux 9
| Feature | top | htop |
|---|---|---|
| Tree view | ❌ | ✅ |
| Color UI | ❌ (basic) | ✅ |
| Mouse support | ❌ | ✅ |
| Interactive kill/renice | ❌ | ✅ |
| Scrollable display | ❌ | ✅ |
| Customizable interface | ❌ | ✅ |
htop is clearly better suited for modern, interactive monitoring tasks in a terminal session.
Advanced Tips for AlmaLinux Users
- View only a specific user’s processes:
htop -u yourusername - Monitor CPU affinity or core usage for services (e.g., database or game servers).
- Use
systemctl statusandhtoptogether to correlate service-level and process-level activity. - Add
htopas part of your server baseline tooling via Ansible, Kickstart, or cloud-init scripts. - Monitor remote servers with
htopover SSH insidetmuxorscreen.
Integration in Enterprise Environments
In production systems, htop is often paired with:
- logrotate, journalctl – for log analysis
- systemd-analyze – to inspect startup performance
- Glances, atop, or Cockpit – for extended visibility
- fail2ban, auditd, firewalld – to monitor system security
htop fits well into cloud VPS, bare-metal, KVM, and container environments that use AlmaLinux 9 as the base OS.
htop on AlmaLinux 9 is a must-have system monitoring tool for any serious Linux server administrator. It offers a clear, color-coded, interactive view of CPU usage, memory consumption, and process behavior, helping teams diagnose issues quickly and manage performance with confidence.
Given AlmaLinux’s long support cycle, compatibility with enterprise tools, and secure defaults, using htop enhances observability without introducing overhead—making it ideal for both development and production deployments.
Whether you’re managing web servers, containers, game servers, or application stacks, htop gives you real-time insight into what’s really happening on your AlmaLinux 9 system.
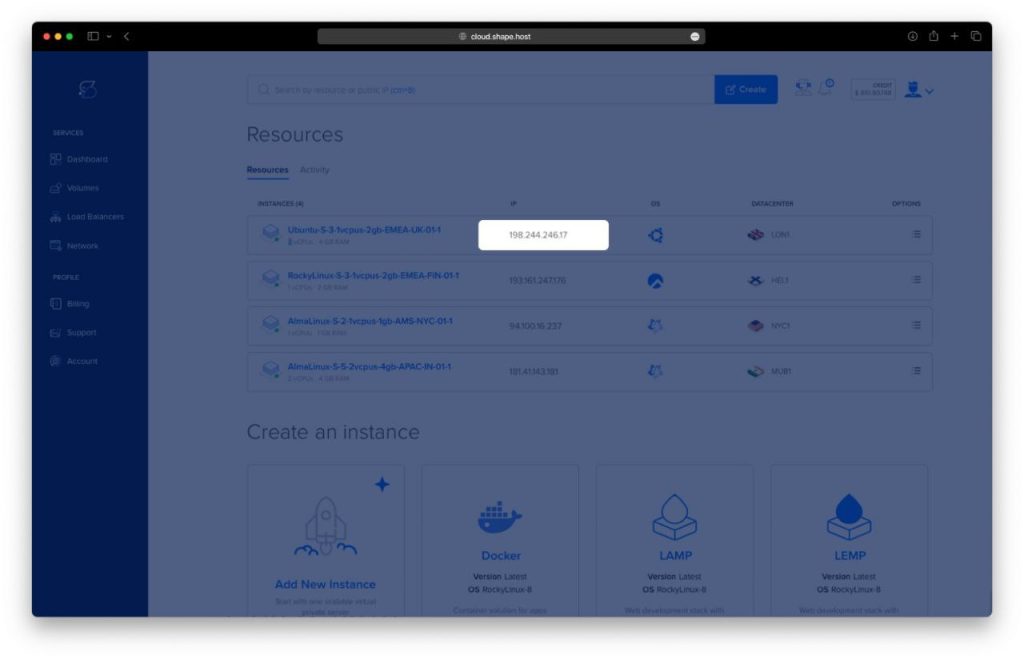
Step 1: Create an AlmaLinux 9 Instance on Shape.Host
Before starting, you can launch a new AlmaLinux 9 server using Shape.Host:
Go to https://shape.host and log in.
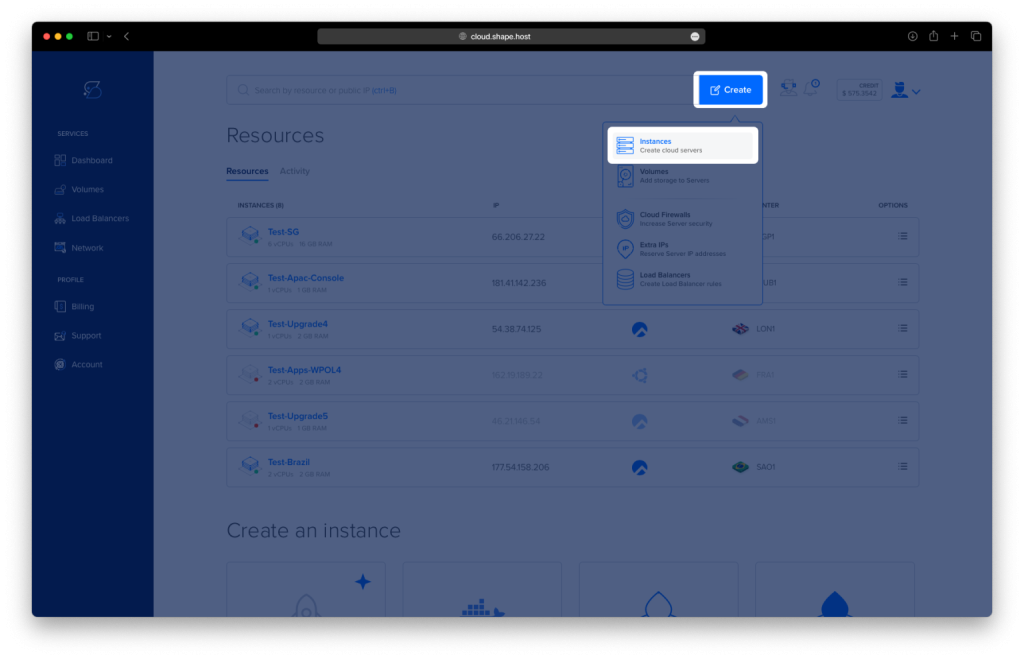
Click “Create” → “Instance.”
Choose location
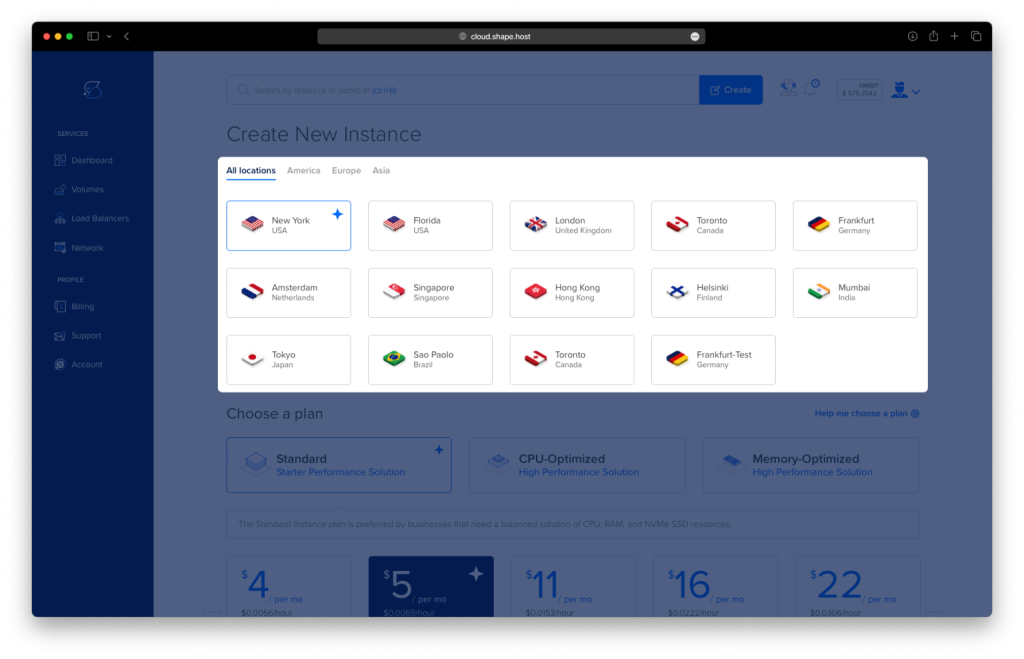
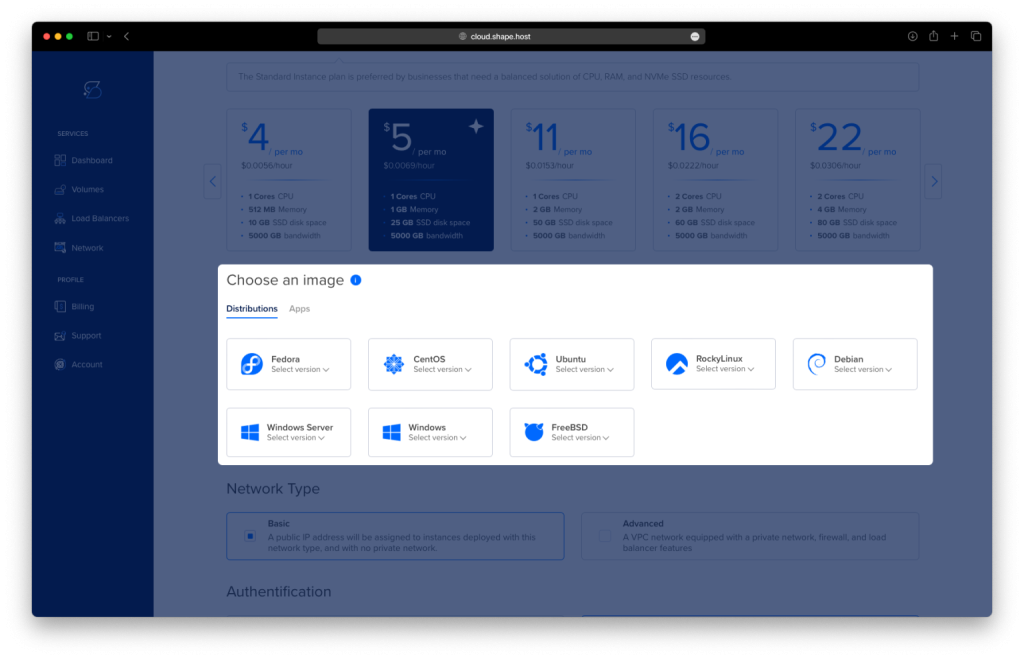
OS: Select AlmaLinux 9 (64-bit)
Plan: Choose a plan based on your needs.
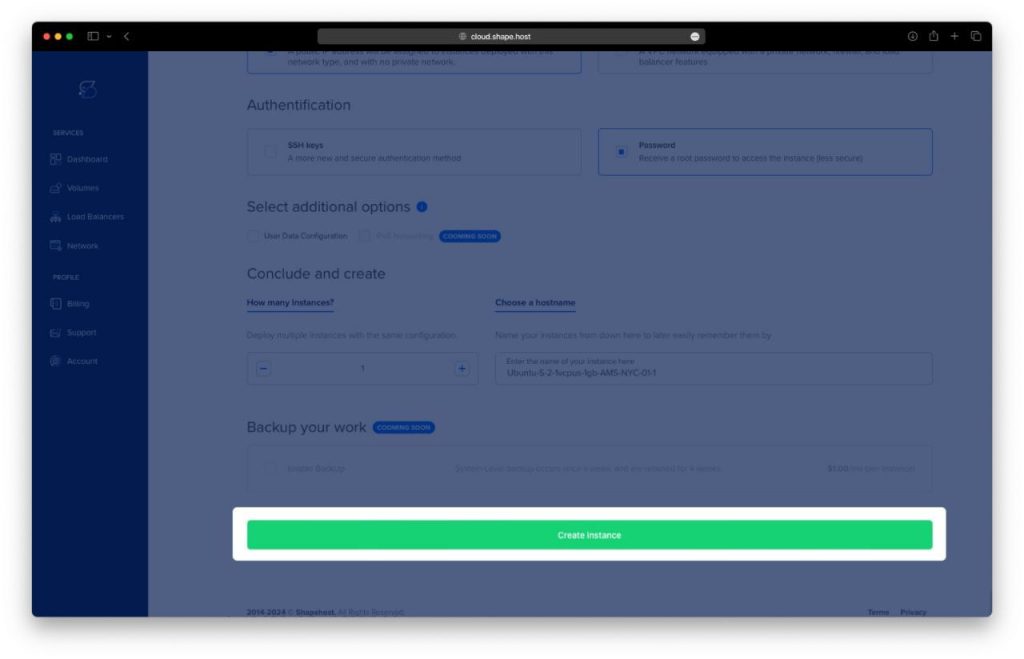
Click Create Instance.
Copy the server IP from the Resources tab.
Step 2: Connect to Your AlmaLinux 9 Server
Use SSH to connect:
ssh root@your_server_ip
Replace your_server_ip with your server’s IP address.
Step 3: Install htop on AlmaLinux 9
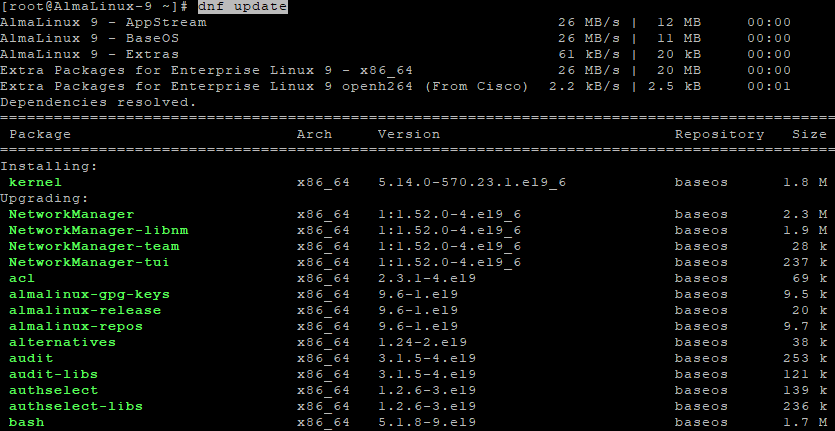
Step 3.1 – Update your system
dnf update
Step 3.2 – Enable EPEL repository
htop is available in the EPEL (Extra Packages for Enterprise Linux) repository, which must be enabled first:
dnf install epel-release

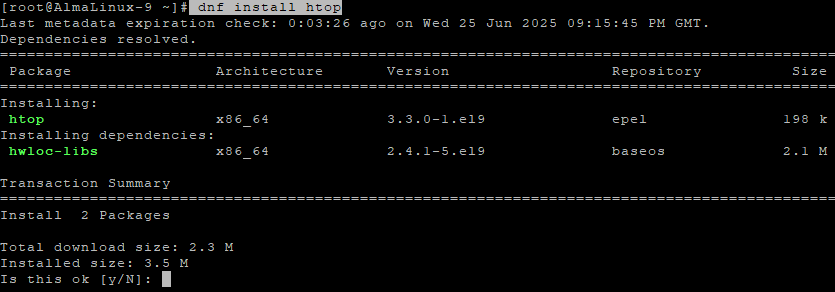
Step 3.3 – Install htop
dnf install htop
Step 3.4 – Verify Installation
htop --version

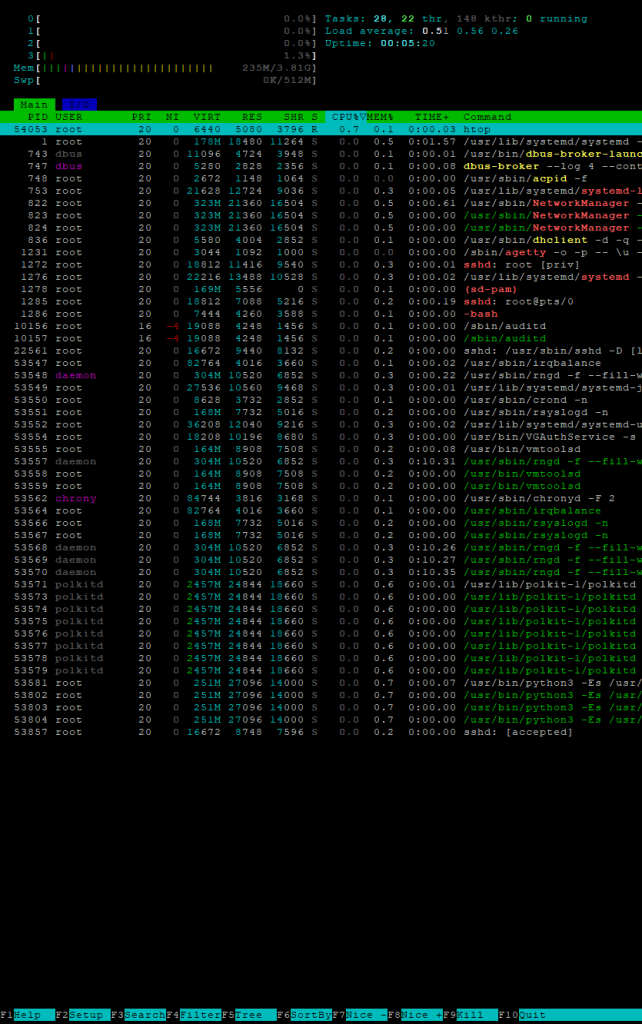
Step 4: Use htop
Launch htop with:
htop
This opens an interactive view of all running processes, system resource usage, and CPU/memory load.
Step 5: Useful Keyboard Shortcuts in htop
| Key | Function |
|---|---|
F1 | Help screen |
F2 | Setup/configure view |
F3 | Search for processes |
F4 | Filter processes |
F5 | Tree view of processes |
F6 | Choose sorting column |
F9 | Kill a selected process |
F10 | Quit htop |
Arrow Keys | Navigate through process list |
Space | Mark/select a process |
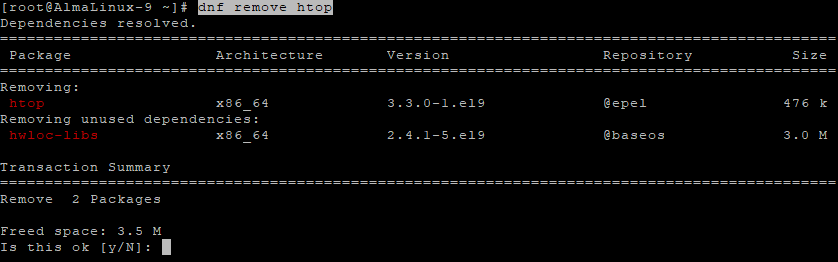
Step 6: Remove htop (Optional)
If you no longer need htop, you can remove it:
dnf remove htop
You’ve now installed and used htop on AlmaLinux 9. This tool is a must-have for system administrators who want to quickly analyze server performance in real time.
Need fast AlmaLinux Cloud VPS hosting? Try Shape.Host to spin up cloud servers in seconds.