What is the Elastic Stack?
The Elastic Stack (formerly known as ELK Stack) is a powerful suite of open-source tools used for searching, analyzing, visualizing, and managing data in real time. It consists of:
- Elasticsearch – A distributed search and analytics engine
- Logstash – A data processing pipeline that ingests, transforms, and sends data
- Kibana – A visualization interface for exploring and analyzing data
- Beats – Lightweight agents that ship data from servers to Logstash or Elasticsearch
Running the Elastic Stack on Ubuntu 24.04 provides a robust and scalable foundation for log management, observability, infrastructure monitoring, threat detection, and search-driven applications.
Key Components
1. Elasticsearch
A distributed RESTful engine that stores and indexes data. It’s the core of the stack, used for search and analytics across large volumes of structured or unstructured data.
2. Logstash
A flexible pipeline tool that collects data from various sources, applies filters and transformations, and forwards it to Elasticsearch or other destinations.
3. Kibana
A web-based dashboard interface for visualizing data in Elasticsearch. Used to create interactive charts, dashboards, and search queries.
4. Beats
Lightweight agents designed to send specific types of data (e.g., logs, metrics, file integrity) to Logstash or Elasticsearch. Examples:
- Filebeat (logs)
- Metricbeat (system and application metrics)
- Packetbeat (network data)
- Auditbeat (security and audit logs)
Use Cases
- Centralized log management (Syslog, Apache logs, Nginx logs, system logs)
- Application performance monitoring
- Security event monitoring (SIEM)
- Infrastructure and system metrics collection
- Real-time alerting and data visualization
- Business intelligence dashboards
- Search functionality in websites or applications
Why Use Elastic Stack on Ubuntu 24.04?
Ubuntu 24.04 is a long-term support (LTS) release ideal for deploying Elastic Stack components due to:
- Stable kernel and updated system libraries
- Long support cycle through 2029
- Official support from Elastic for Ubuntu via APT repositories
- Improved performance with systemd, cgroups v2, and secure defaults
- Full compatibility with Docker, containers, and orchestration tools like Kubernetes
System Requirements (General Guide)
| Component | Recommended Minimum |
|---|---|
| OS | Ubuntu 24.04 LTS (64-bit) |
| CPU | 2–4 cores for Elasticsearch nodes |
| RAM | 4 GB+ (8 GB recommended for Elasticsearch) |
| Disk Space | SSD strongly recommended, 20 GB+ minimum |
| Java Runtime | Bundled with Elasticsearch 8 (uses its own) |
| Network | Ports 9200 (HTTP), 9300 (cluster), others as needed |
Benefits of Using the Elastic Stack
- Real-time data analysis with scalable ingestion pipelines
- Open-source and extensible with commercial options available
- Built-in security features (authentication, role-based access, TLS)
- Pre-built dashboards and visualizations
- RESTful APIs for easy integration with applications and services
- Multi-tenancy and clustering support for large-scale deployments
Elastic Stack vs Other Observability Tools
| Feature | Elastic Stack | Prometheus + Grafana | Splunk |
|---|---|---|---|
| Data Storage | Elasticsearch | TSDB (Prometheus) | Proprietary index |
| Visualization | Kibana | Grafana | Splunk Dashboard |
| Logs and Metrics | Yes | Metrics only (logs via Loki) | Yes |
| Open Source | Yes (basic features) | Yes | No (paid) |
| Scalability | High | High | High (enterprise only) |
| Use Case | Logs + metrics + search | Metrics and alerts | Enterprise SIEM/logs |
Security and Best Practices
- Enable TLS encryption for all communications between nodes
- Use role-based access control (RBAC) with built-in or external authentication (LDAP, SAML, OIDC)
- Keep the Elastic Stack components updated
- Restrict access to Kibana dashboards using authentication
- Monitor resource usage and configure index lifecycle management (ILM) to control disk space
- Set up alerting using Watcher or ElastAlert for critical conditions
Elastic Stack on Ubuntu 24.04 offers a modern, scalable, and highly flexible platform for collecting, analyzing, and visualizing structured and unstructured data in real time. Whether you’re managing logs, monitoring system health, or powering search features in your application, the Elastic Stack provides the tools you need, and Ubuntu 24.04 ensures a secure and reliable environment for running it.
This stack is especially valuable for DevOps teams, system administrators, security professionals, and developers who need full visibility and insight across applications and infrastructure.
Step 1: Deploy a New Server on Shape.Host
To start, set up a clean Ubuntu 24.04 server on Shape.Host:
Visit https://shape.host and log in.
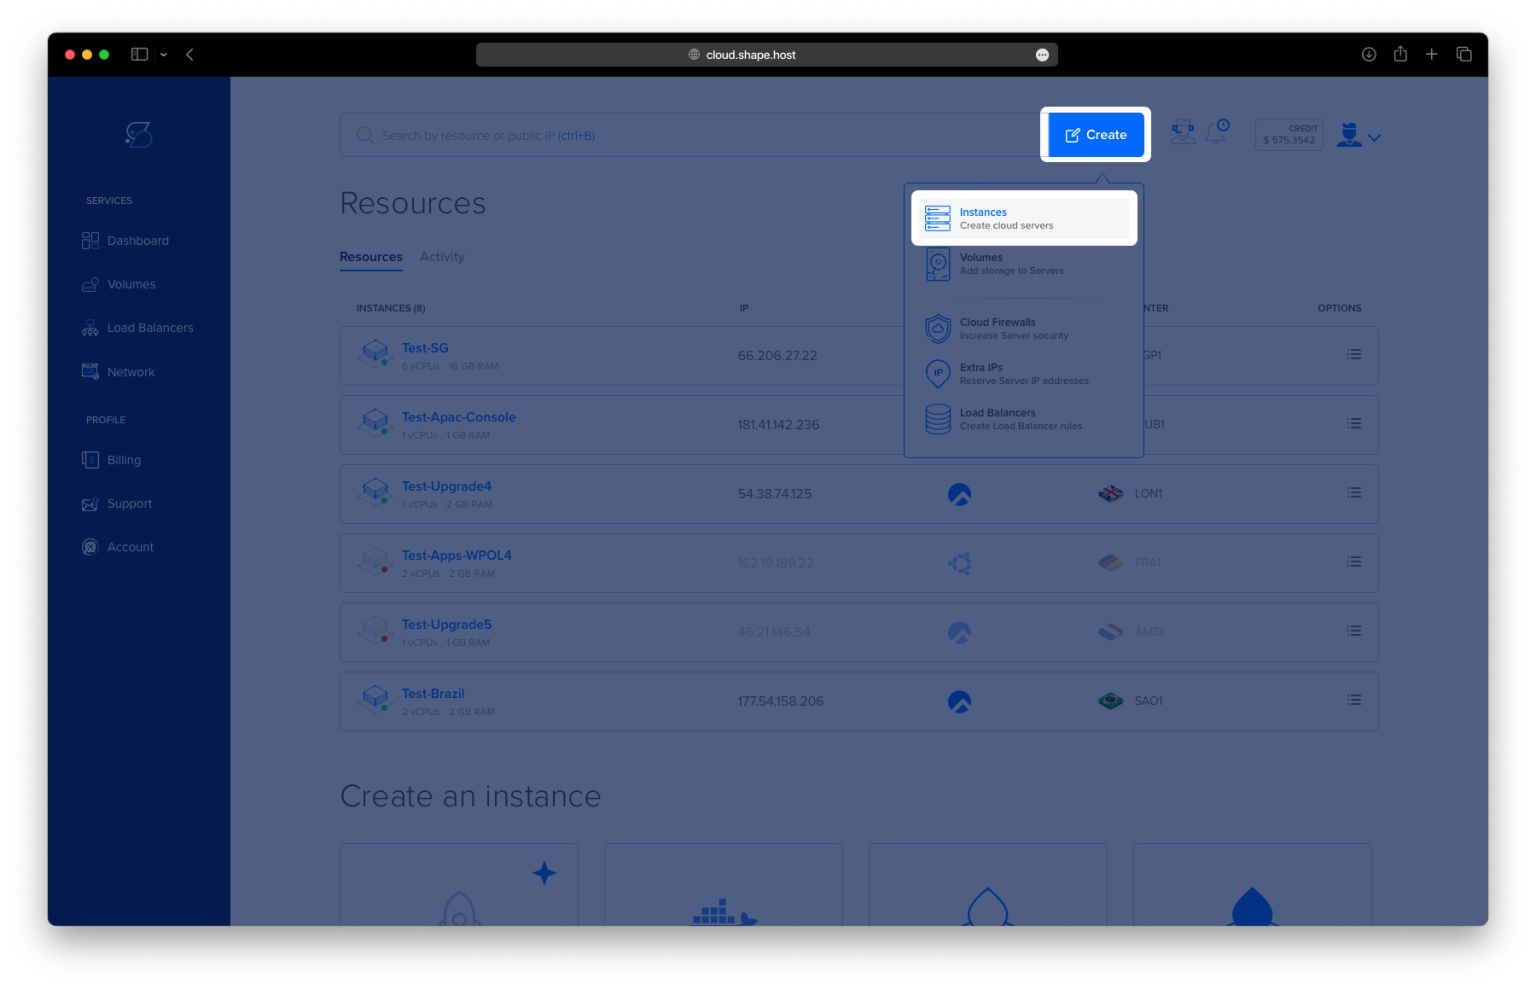
Click on “Create”, then choose “Instance”.

Pick a server location near you or your users.

Set the OS to Ubuntu 24.04 (64-bit).
Select a plan with at least 2 CPUs, 4 GB RAM, and 40 GB SSD.

Click “Create Instance”.

After deployment, copy the IP address from the Resources tab.

Step 2: Connect to Your Server
From Linux/macOS:
ssh root@your_server_ip
From Windows, use PuTTY to connect via SSH.
Step 3: Prepare the System
Update the system’s package list:
apt update

Install HTTPS support for APT:
apt install apt-transport-https

Install Java (required by Elasticsearch and Logstash):
apt install openjdk-11-jdk

Check the installed Java version:
java -version

Step 4: Set the JAVA_HOME Environment Variable
Open the environment config:
nano /etc/environment
Add the following line at the bottom:
JAVA_HOME="/usr/lib/jvm/java-11-openjdk-amd64"

Then reload the file:
source /etc/environment
echo $JAVA_HOME

Step 5: Add Elastic Repository and Key
Download and add the GPG key:
wget -qO - https://artifacts.elastic.co/GPG-KEY-elasticsearch | sudo gpg --dearmor -o /usr/share/keyrings/elasticsearch-keyring.gpg
Add the Elastic APT repository:
echo "deb [signed-by=/usr/share/keyrings/elasticsearch-keyring.gpg] https://artifacts.elastic.co/packages/8.x/apt stable main" | sudo tee /etc/apt/sources.list.d/elastic-8.x.list
Update packages again:
apt-get update

Step 6: Install and Configure Elasticsearch
Install Elasticsearch:
apt-get install elasticsearch

Start the service:
systemctl start elasticsearch
systemctl enable elasticsearch
systemctl status elasticsearch

Configure it to accept connections:
nano /etc/elasticsearch/elasticsearch.yml
Uncomment and modify these lines:
network.host: 0.0.0.0
discovery.seed_hosts: []

For a basic setup (not recommended for production), disable security features.

Restart Elasticsearch:
systemctl restart elasticsearch
Verify it’s running:
curl -X GET "localhost:9200"

Step 7: Install Logstash
apt-get install logstash
systemctl start logstash
systemctl enable logstash
systemctl status logstash


Step 8: Install and Configure Kibana
apt-get install kibana
systemctl start kibana
systemctl enable kibana
systemctl status kibana


Edit the Kibana config:
nano /etc/kibana/kibana.yml
Uncomment and adjust these lines:
server.port: 5601
server.host: "0.0.0.0"
elasticsearch.hosts: ["http://localhost:9200"]

Restart Kibana:
systemctl restart kibana

Now go to your browser and open:
http://your-server-ip:5601

Step 9: Install and Configure Filebeat
Install Filebeat:
apt-get install filebeat

Edit Filebeat config:
nano /etc/filebeat/filebeat.yml
Comment out the default Elasticsearch output:
# output.elasticsearch:
#   hosts: ["localhost:9200"]
Then enable Logstash output:
output.logstash:
  hosts: ["localhost:5044"]

Enable system log module:
filebeat modules enable system
Run initial setup:
filebeat setup --index-management -E output.logstash.enabled=false -E 'output.elasticsearch.hosts=["0.0.0.0:9200"]'

Start and enable Filebeat:
systemctl start filebeat
systemctl enable filebeat
Step 10: View Elasticsearch Indices
Check that logs are being sent to Elasticsearch:
curl -XGET "localhost:9200/_cat/indices?v"

You now have a complete ELK Stack (Elasticsearch, Logstash, Kibana, Filebeat) running on Ubuntu 24.04.
Why Shape.Host is perfect for running Elastic Stack:
- High-performance Cloud SSD VPS servers
- Fast provisioning with Ubuntu 24.04
- Global data centers for low latency
- Flexible plans to scale with your data needs